Commercial Gaming Revenue Tracker
July 2026 Commercial gaming Revenue Tracker
The American Gaming Association’s (AGA) Commercial Gaming Revenue Tracker features state-by-state and nationwide financial performance data with breakdowns for individual gaming verticals.
TOPLINE INDUSTRY TRENDS
Strong Growth Across All Verticals: U.S. commercial gaming revenue grew 8.6 percent in July driven by strong sports betting revenue that was boosted by the World Cup.
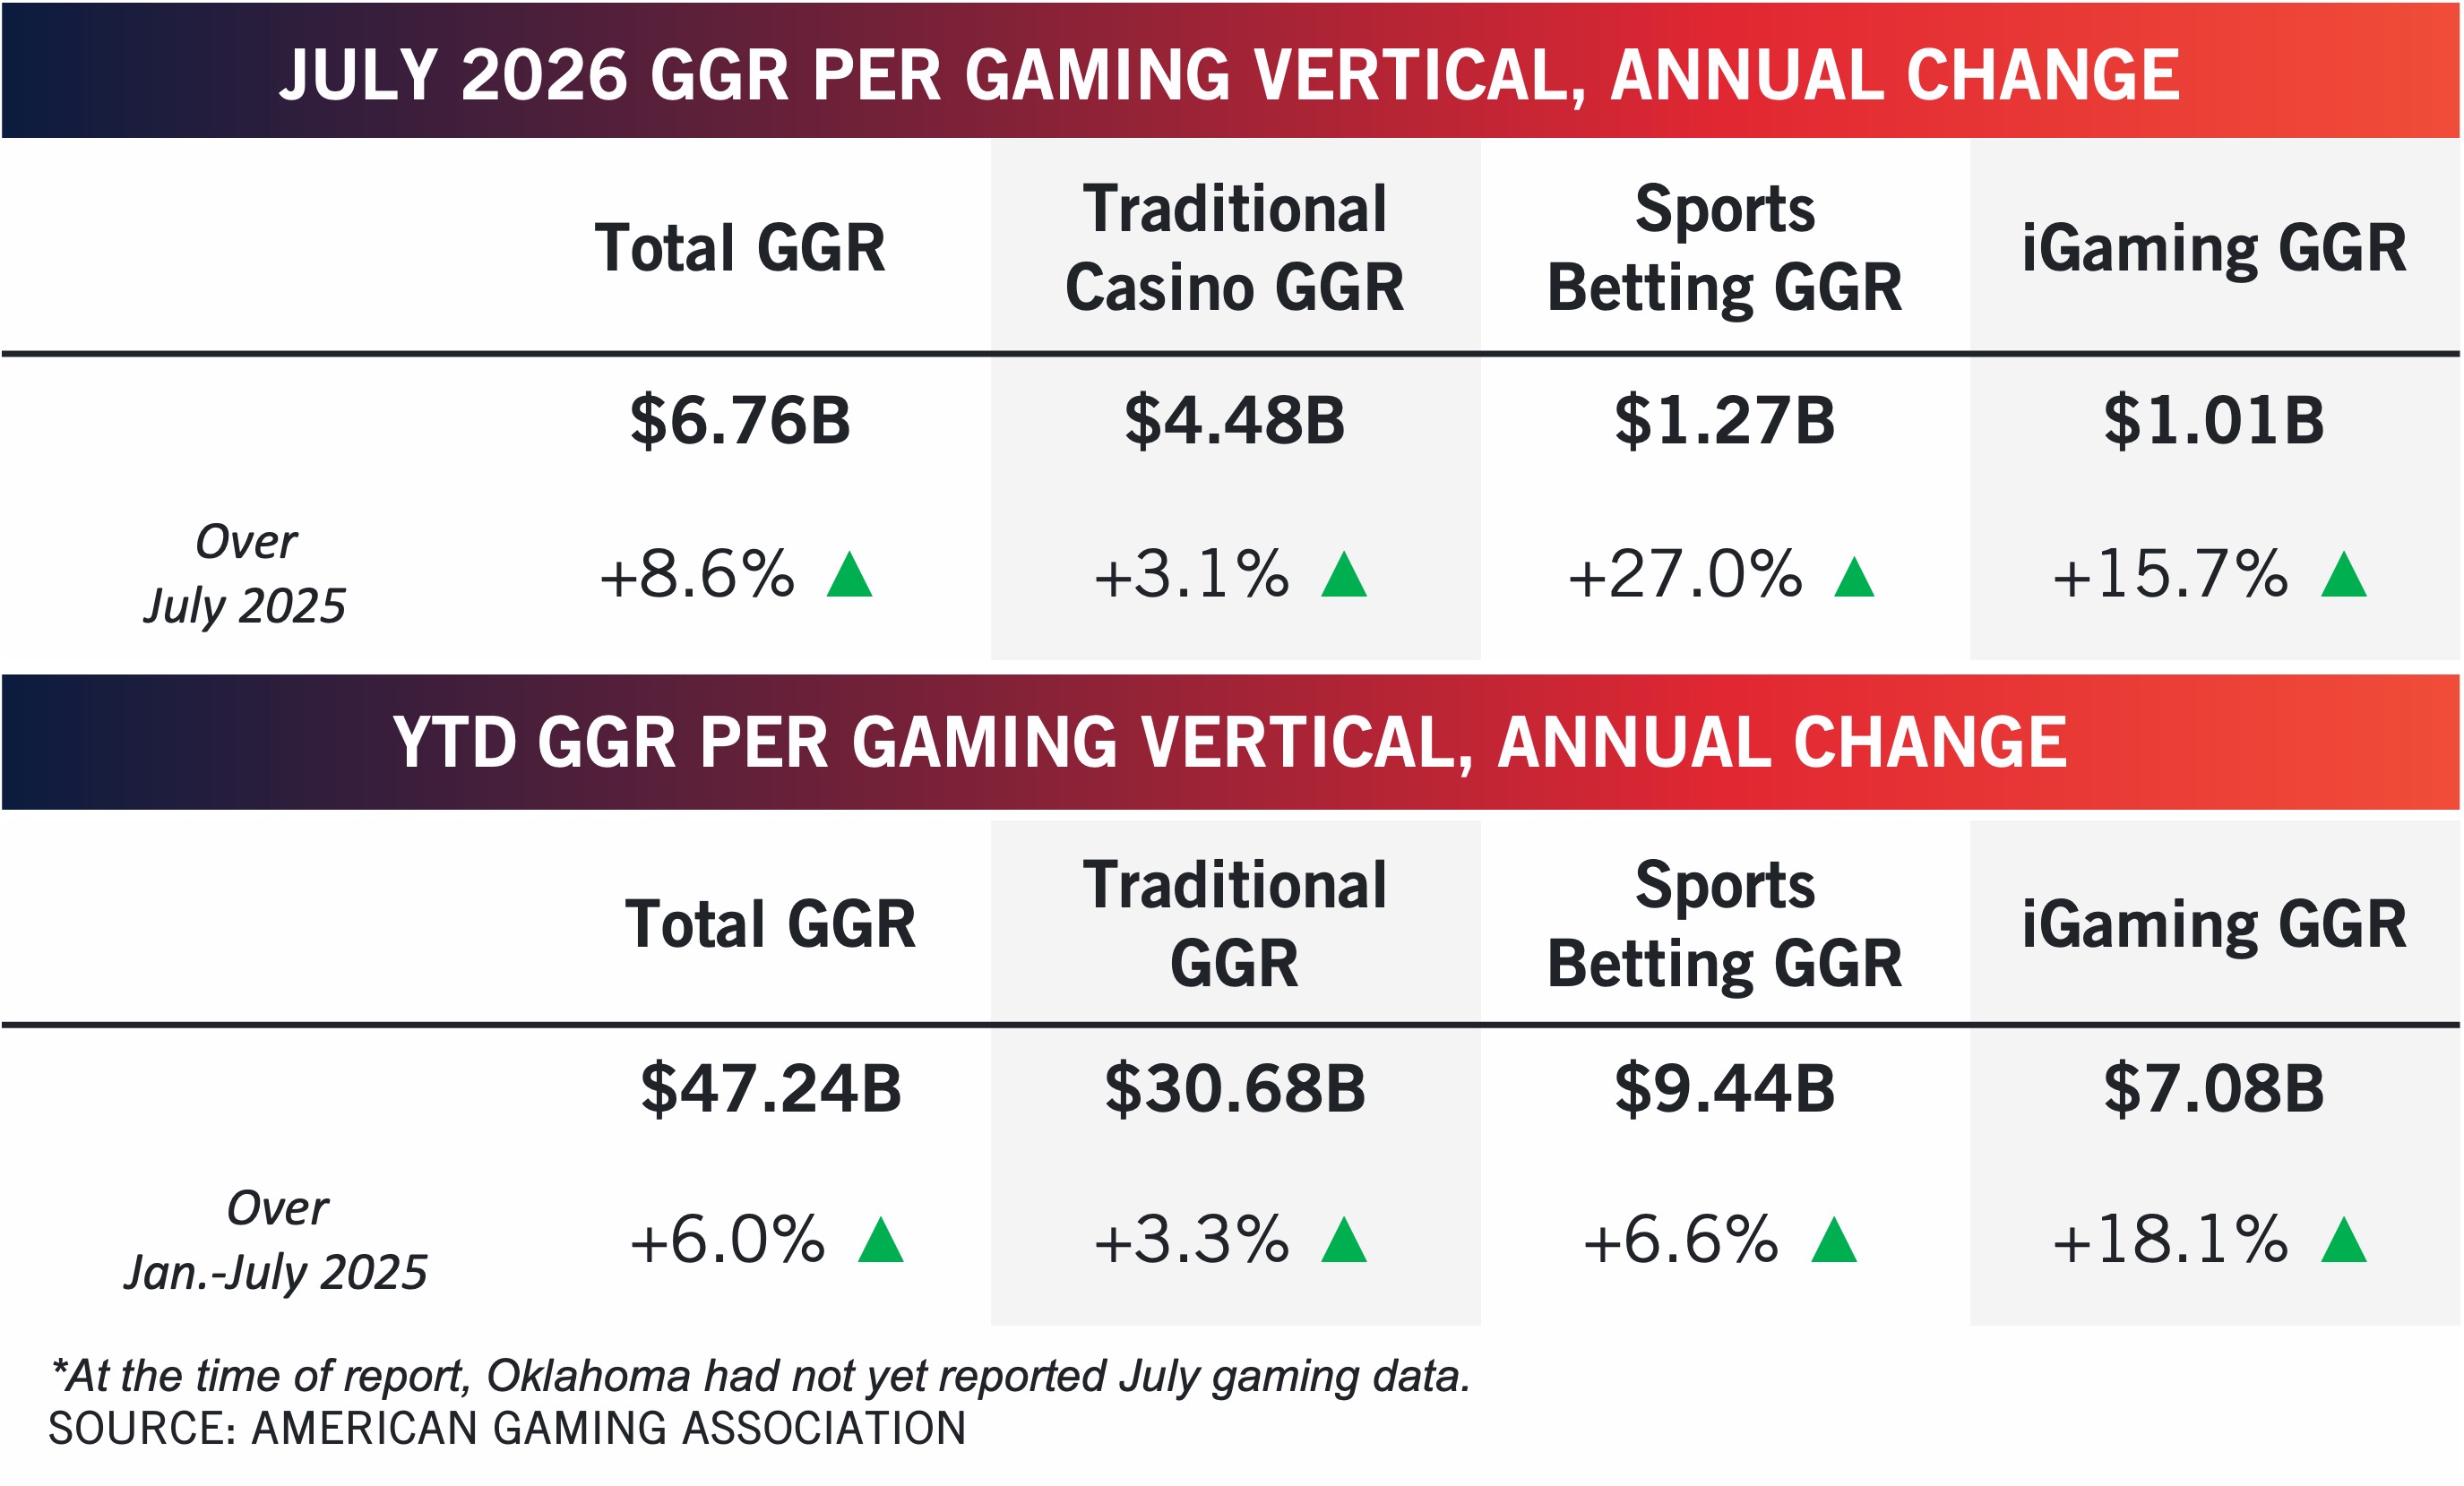

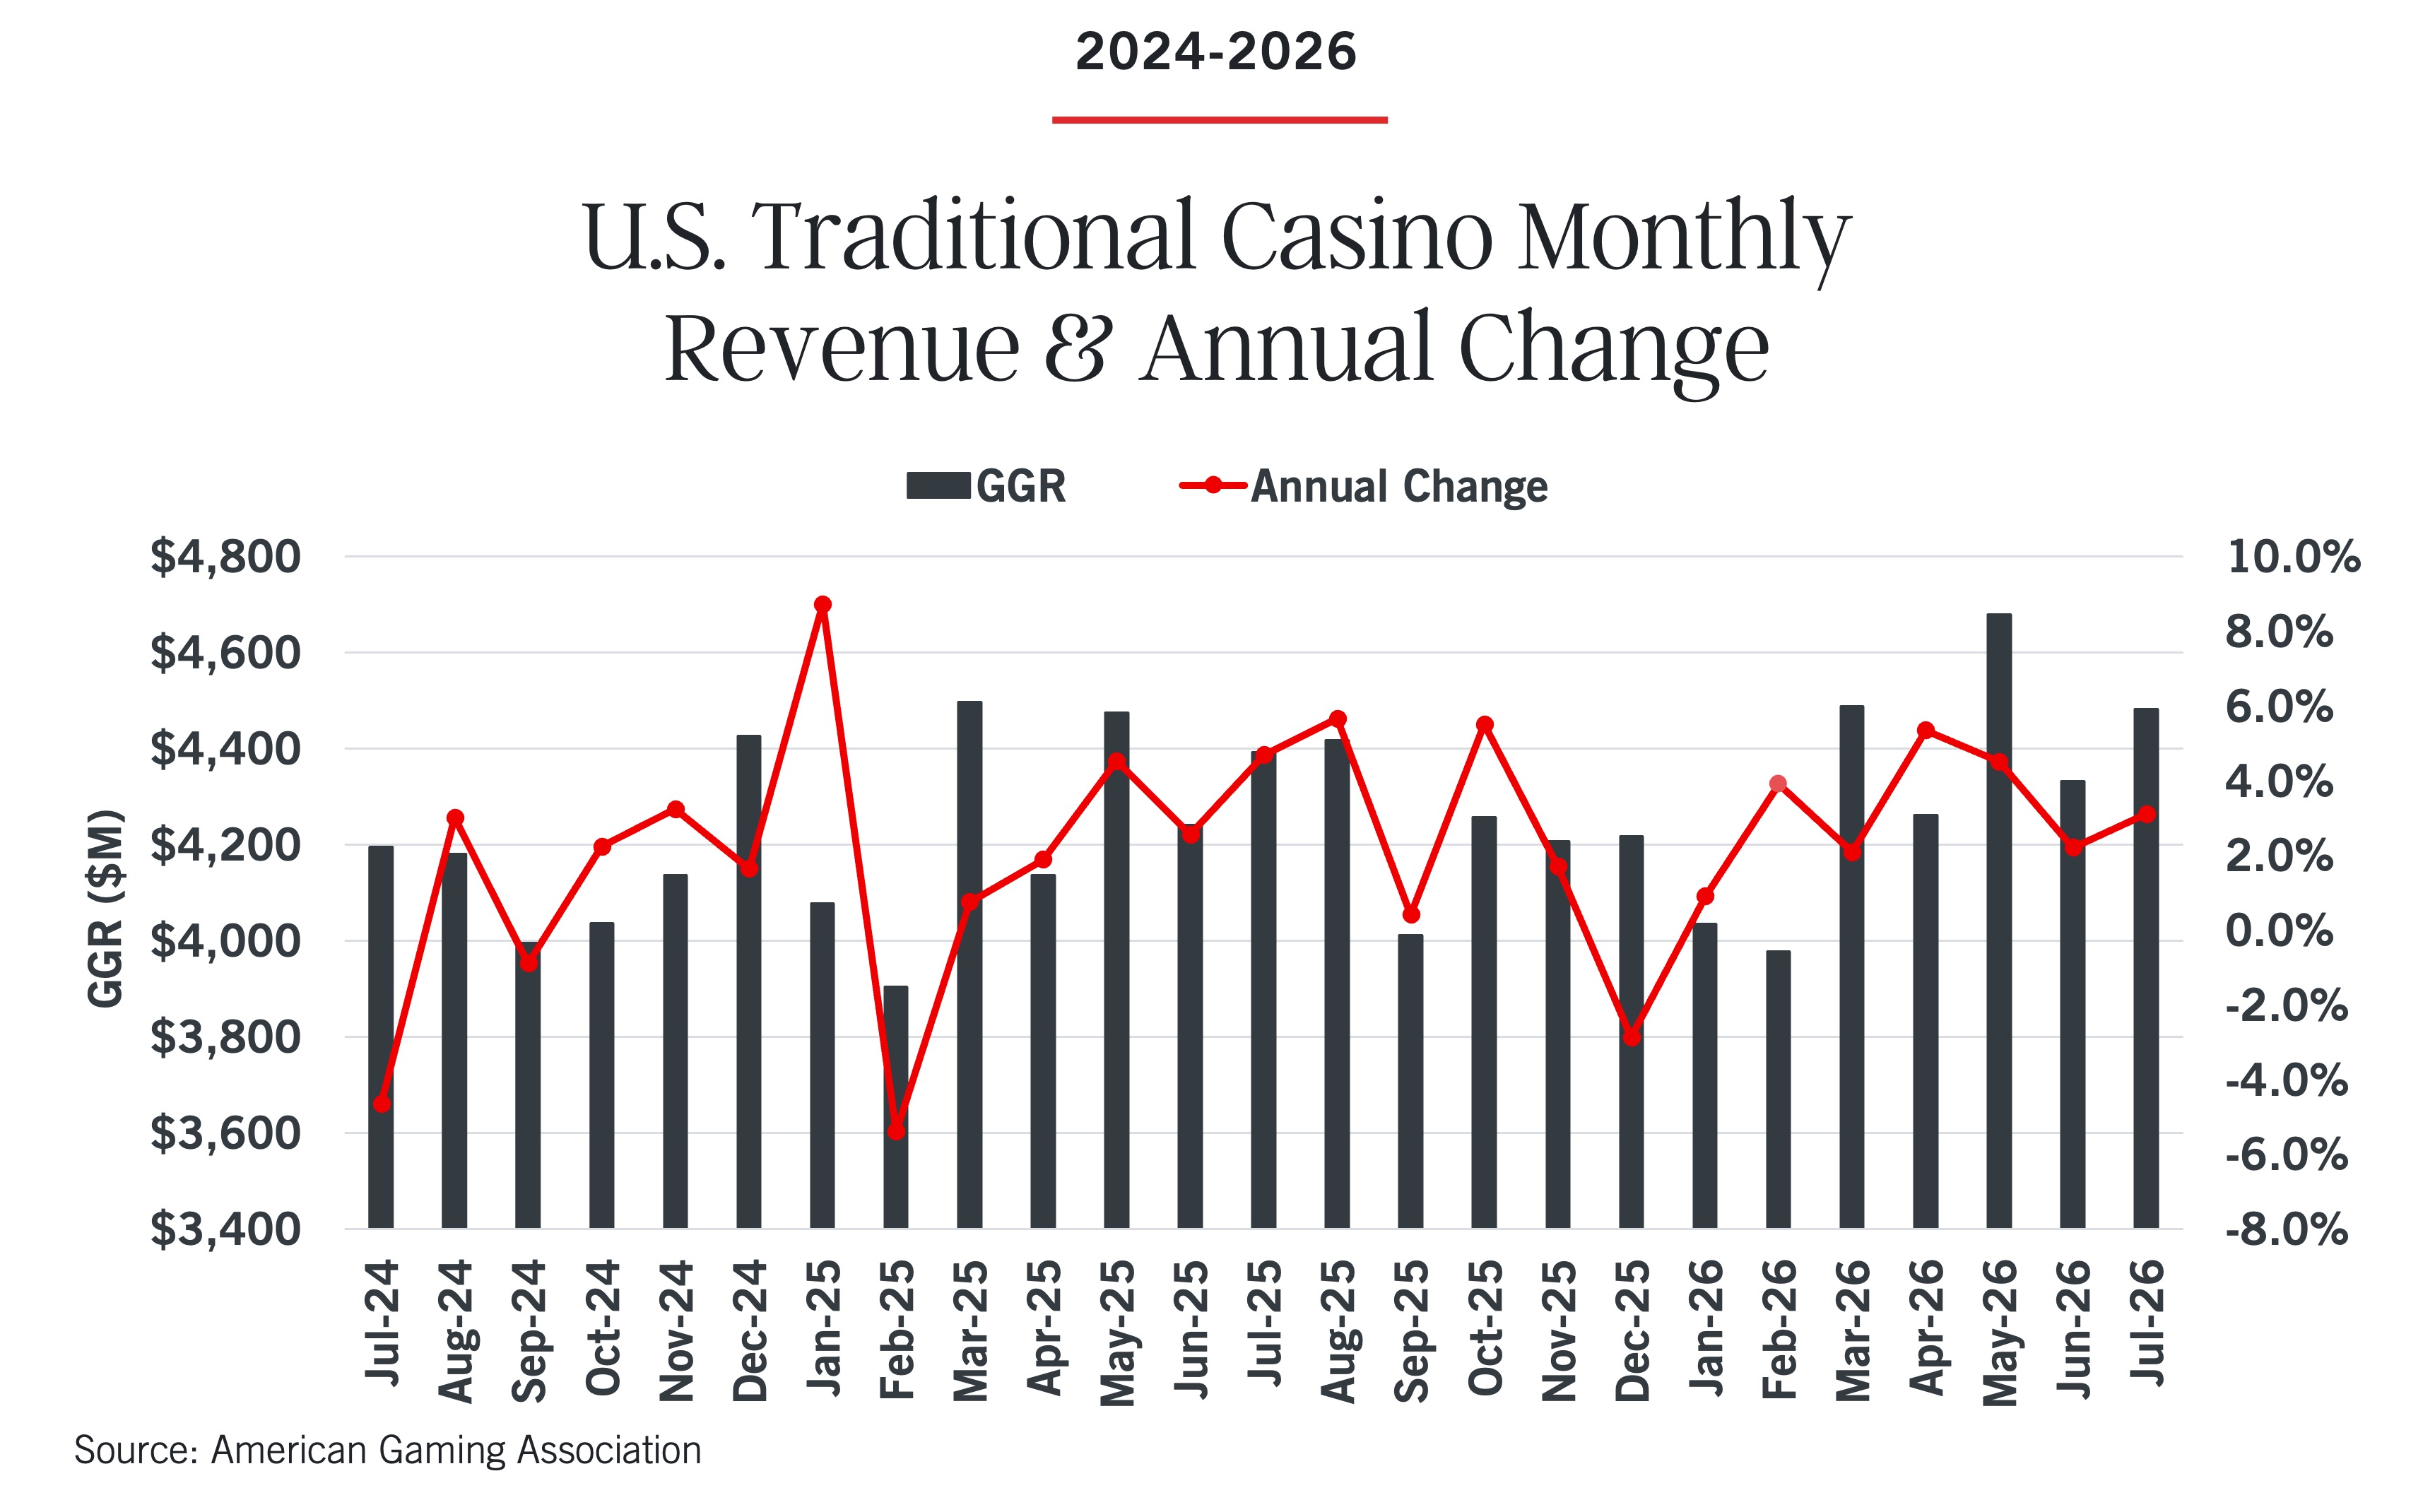
Traditional casino gaming expanded by 3.1 percent to $4.48 billion.
- Slot machines generated $3.25 billion (+0.9%)
- Table games revenue generated $876.8 million (+6.2%)
$3.25 Billion
generated by slot machines in July 2026.
$876.8 Million
generated by table games in July 2026.
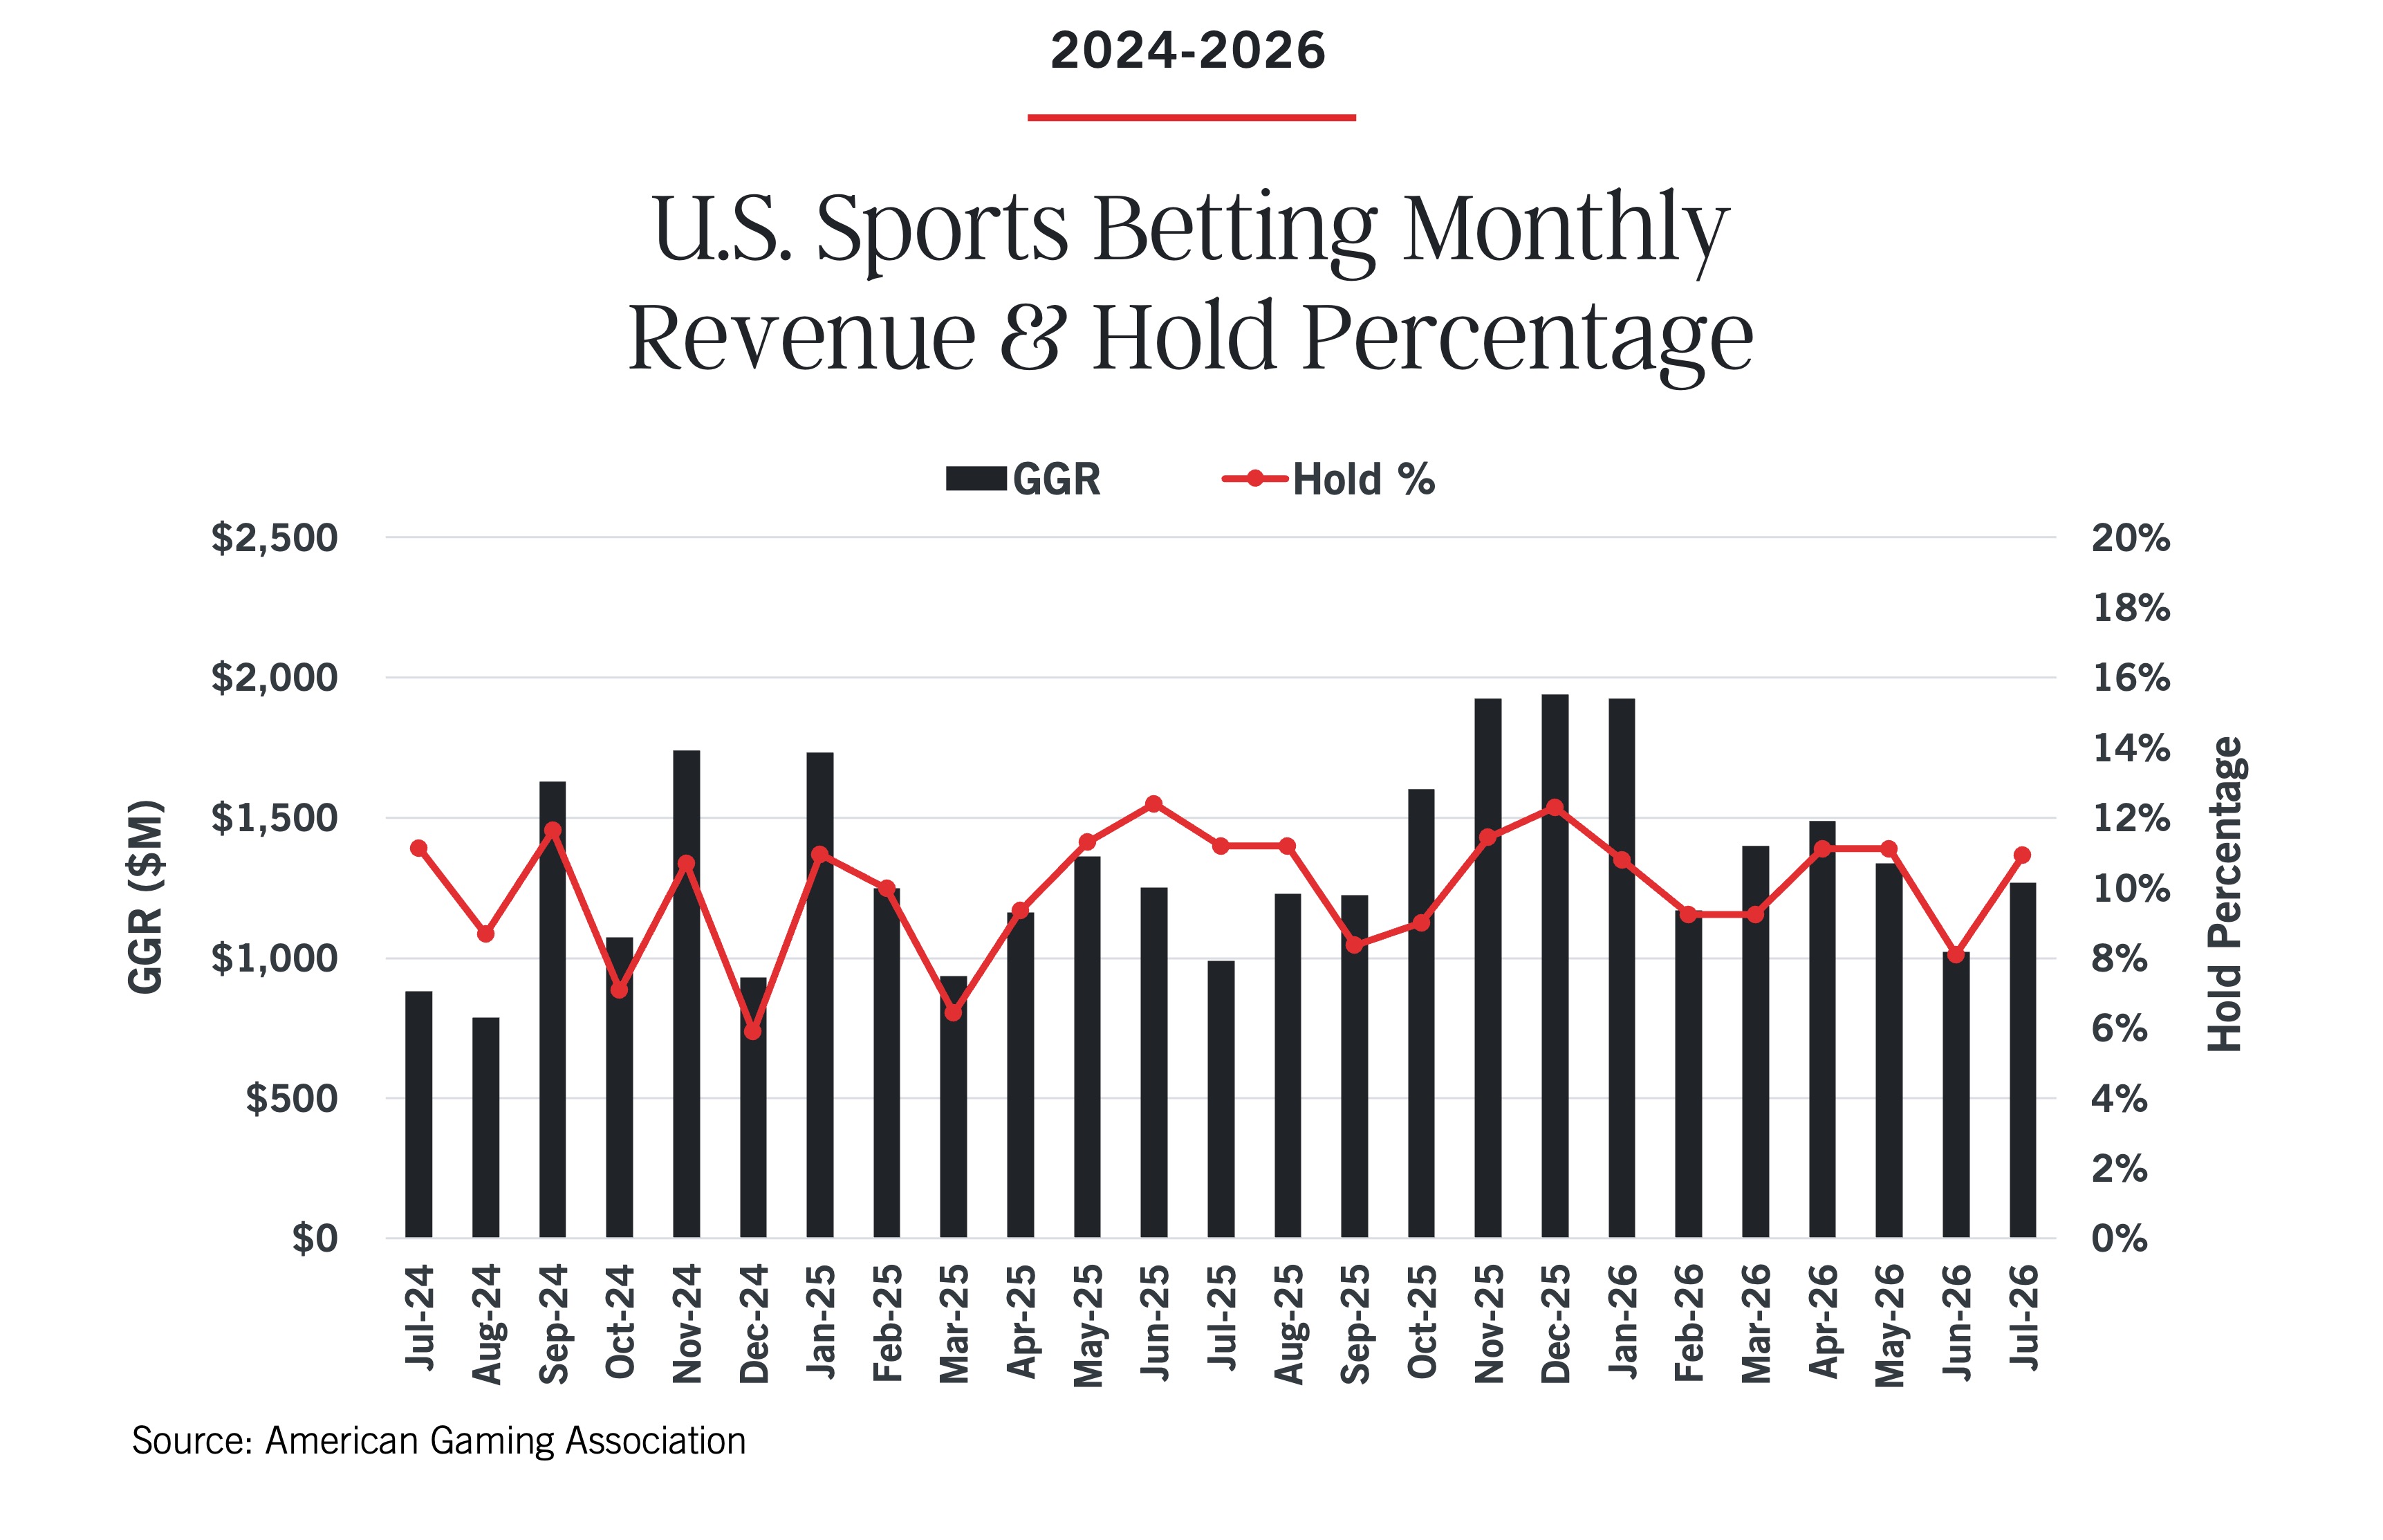
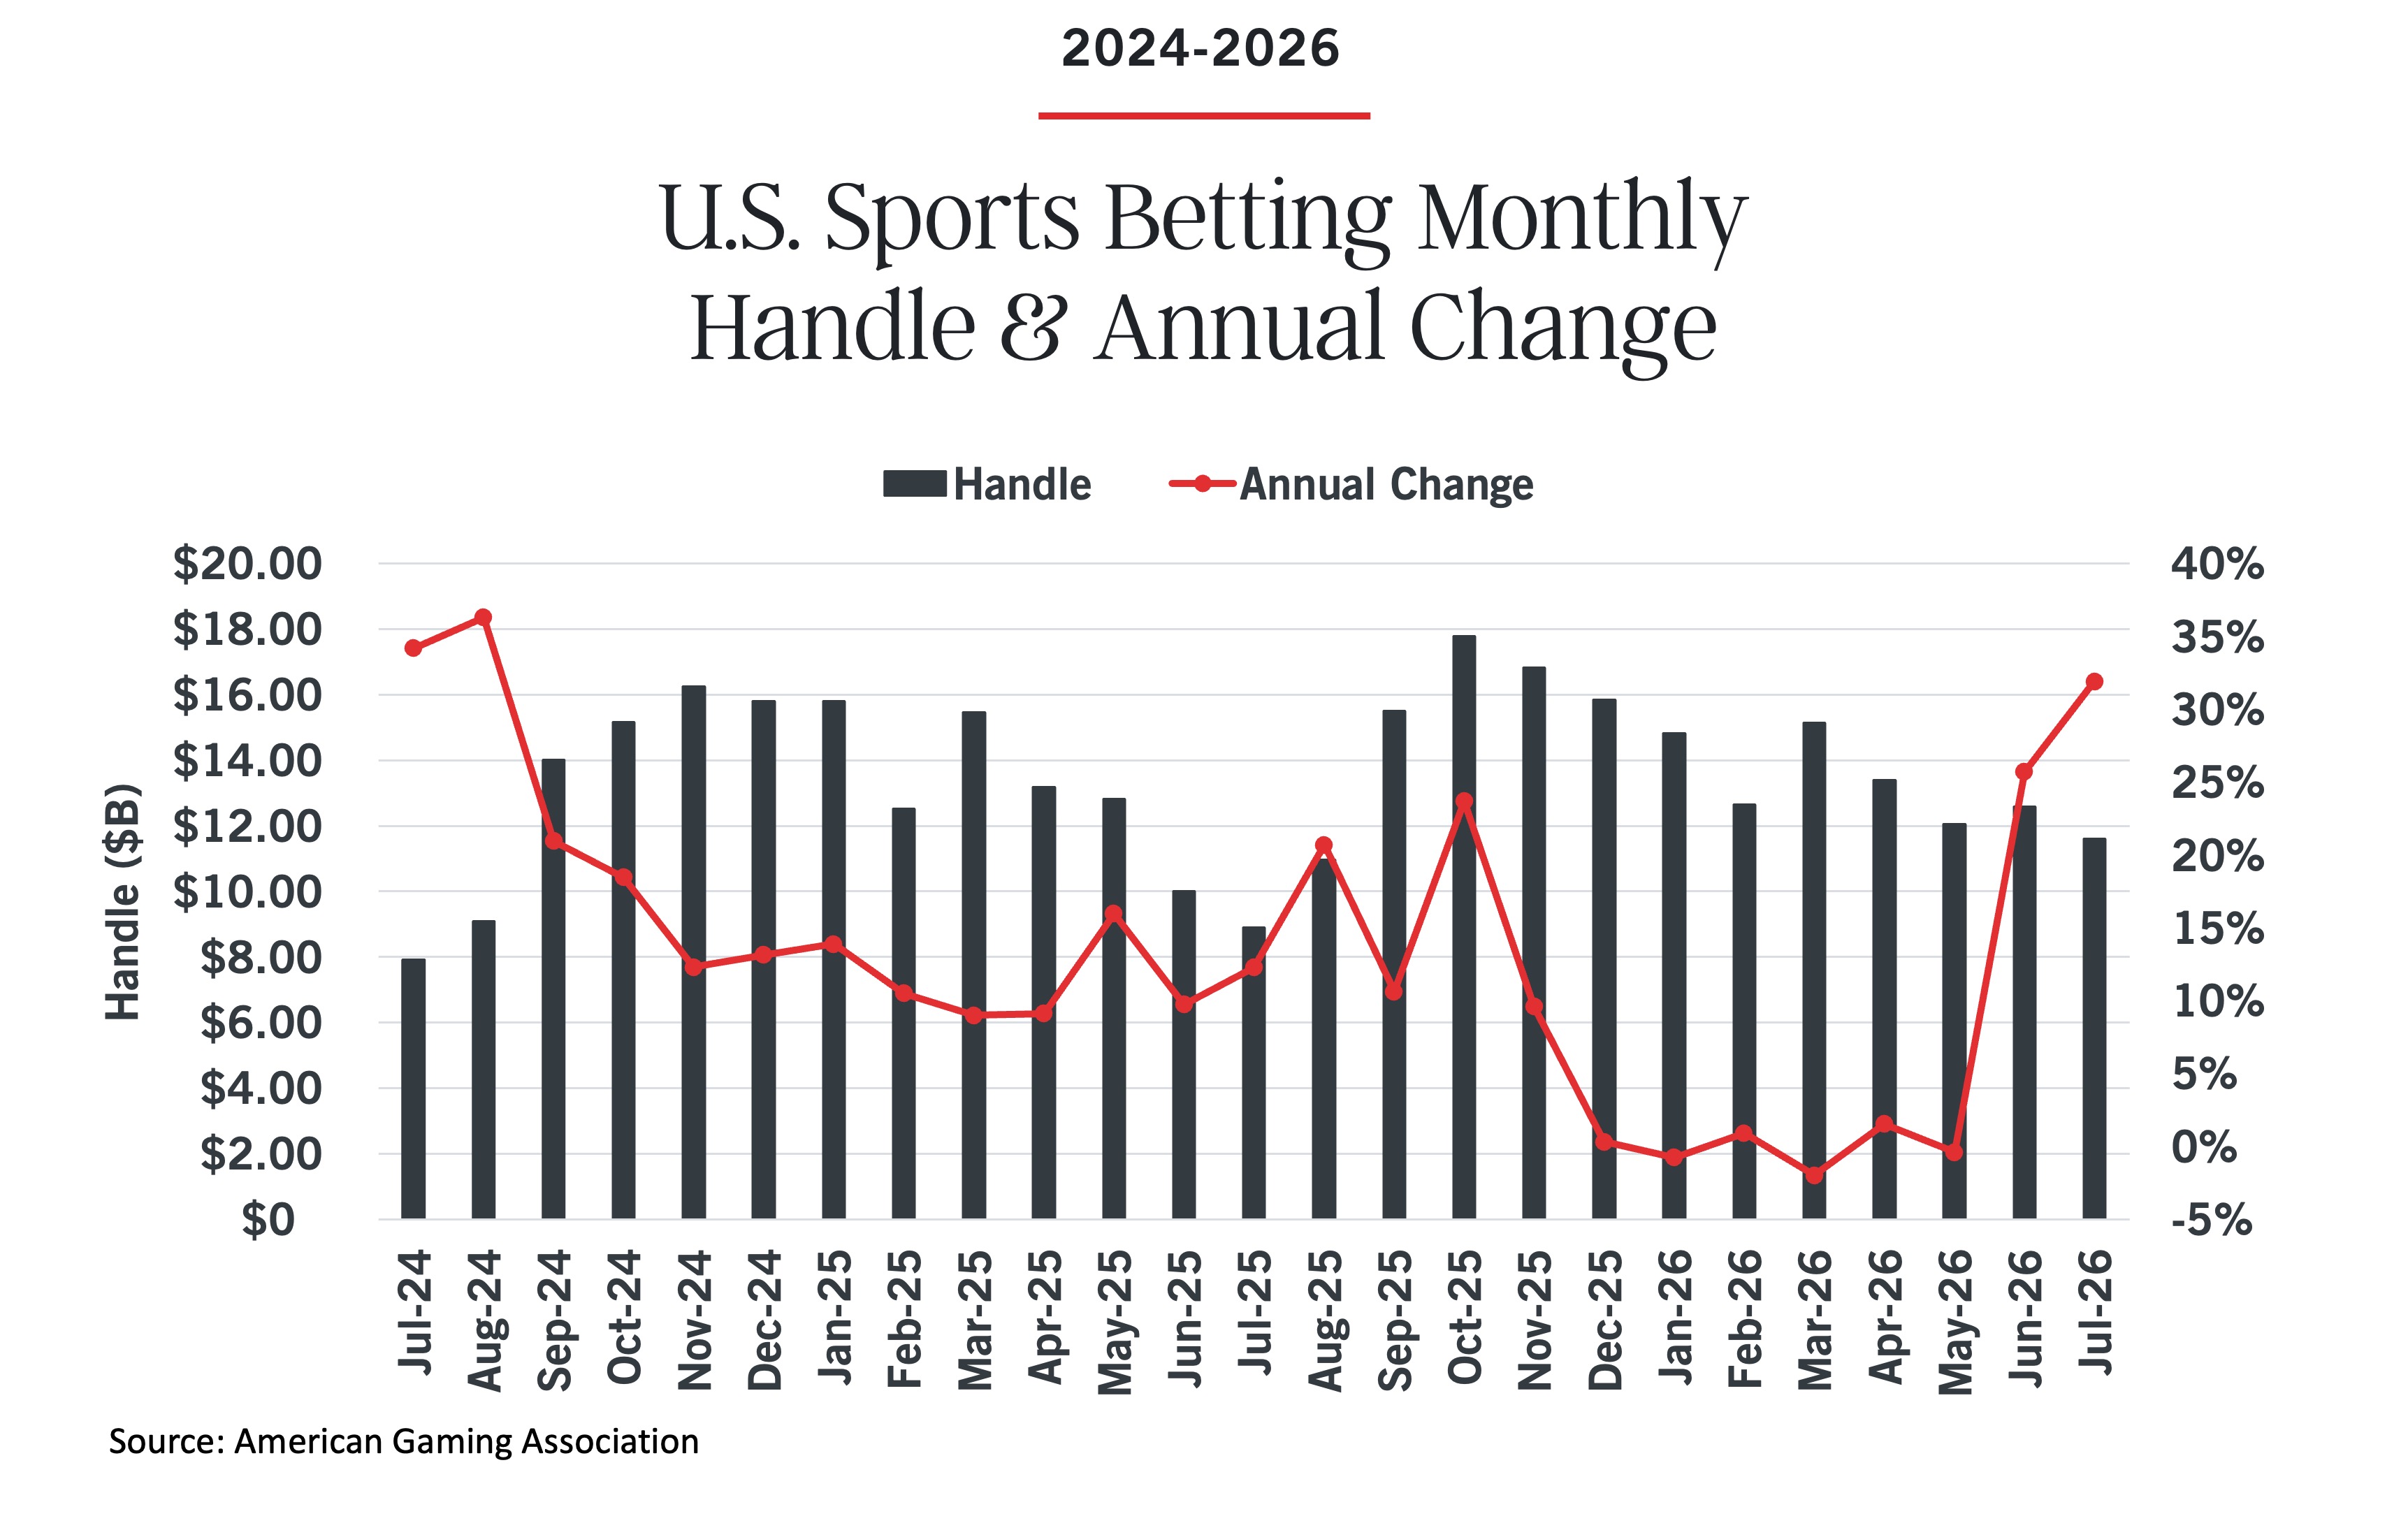
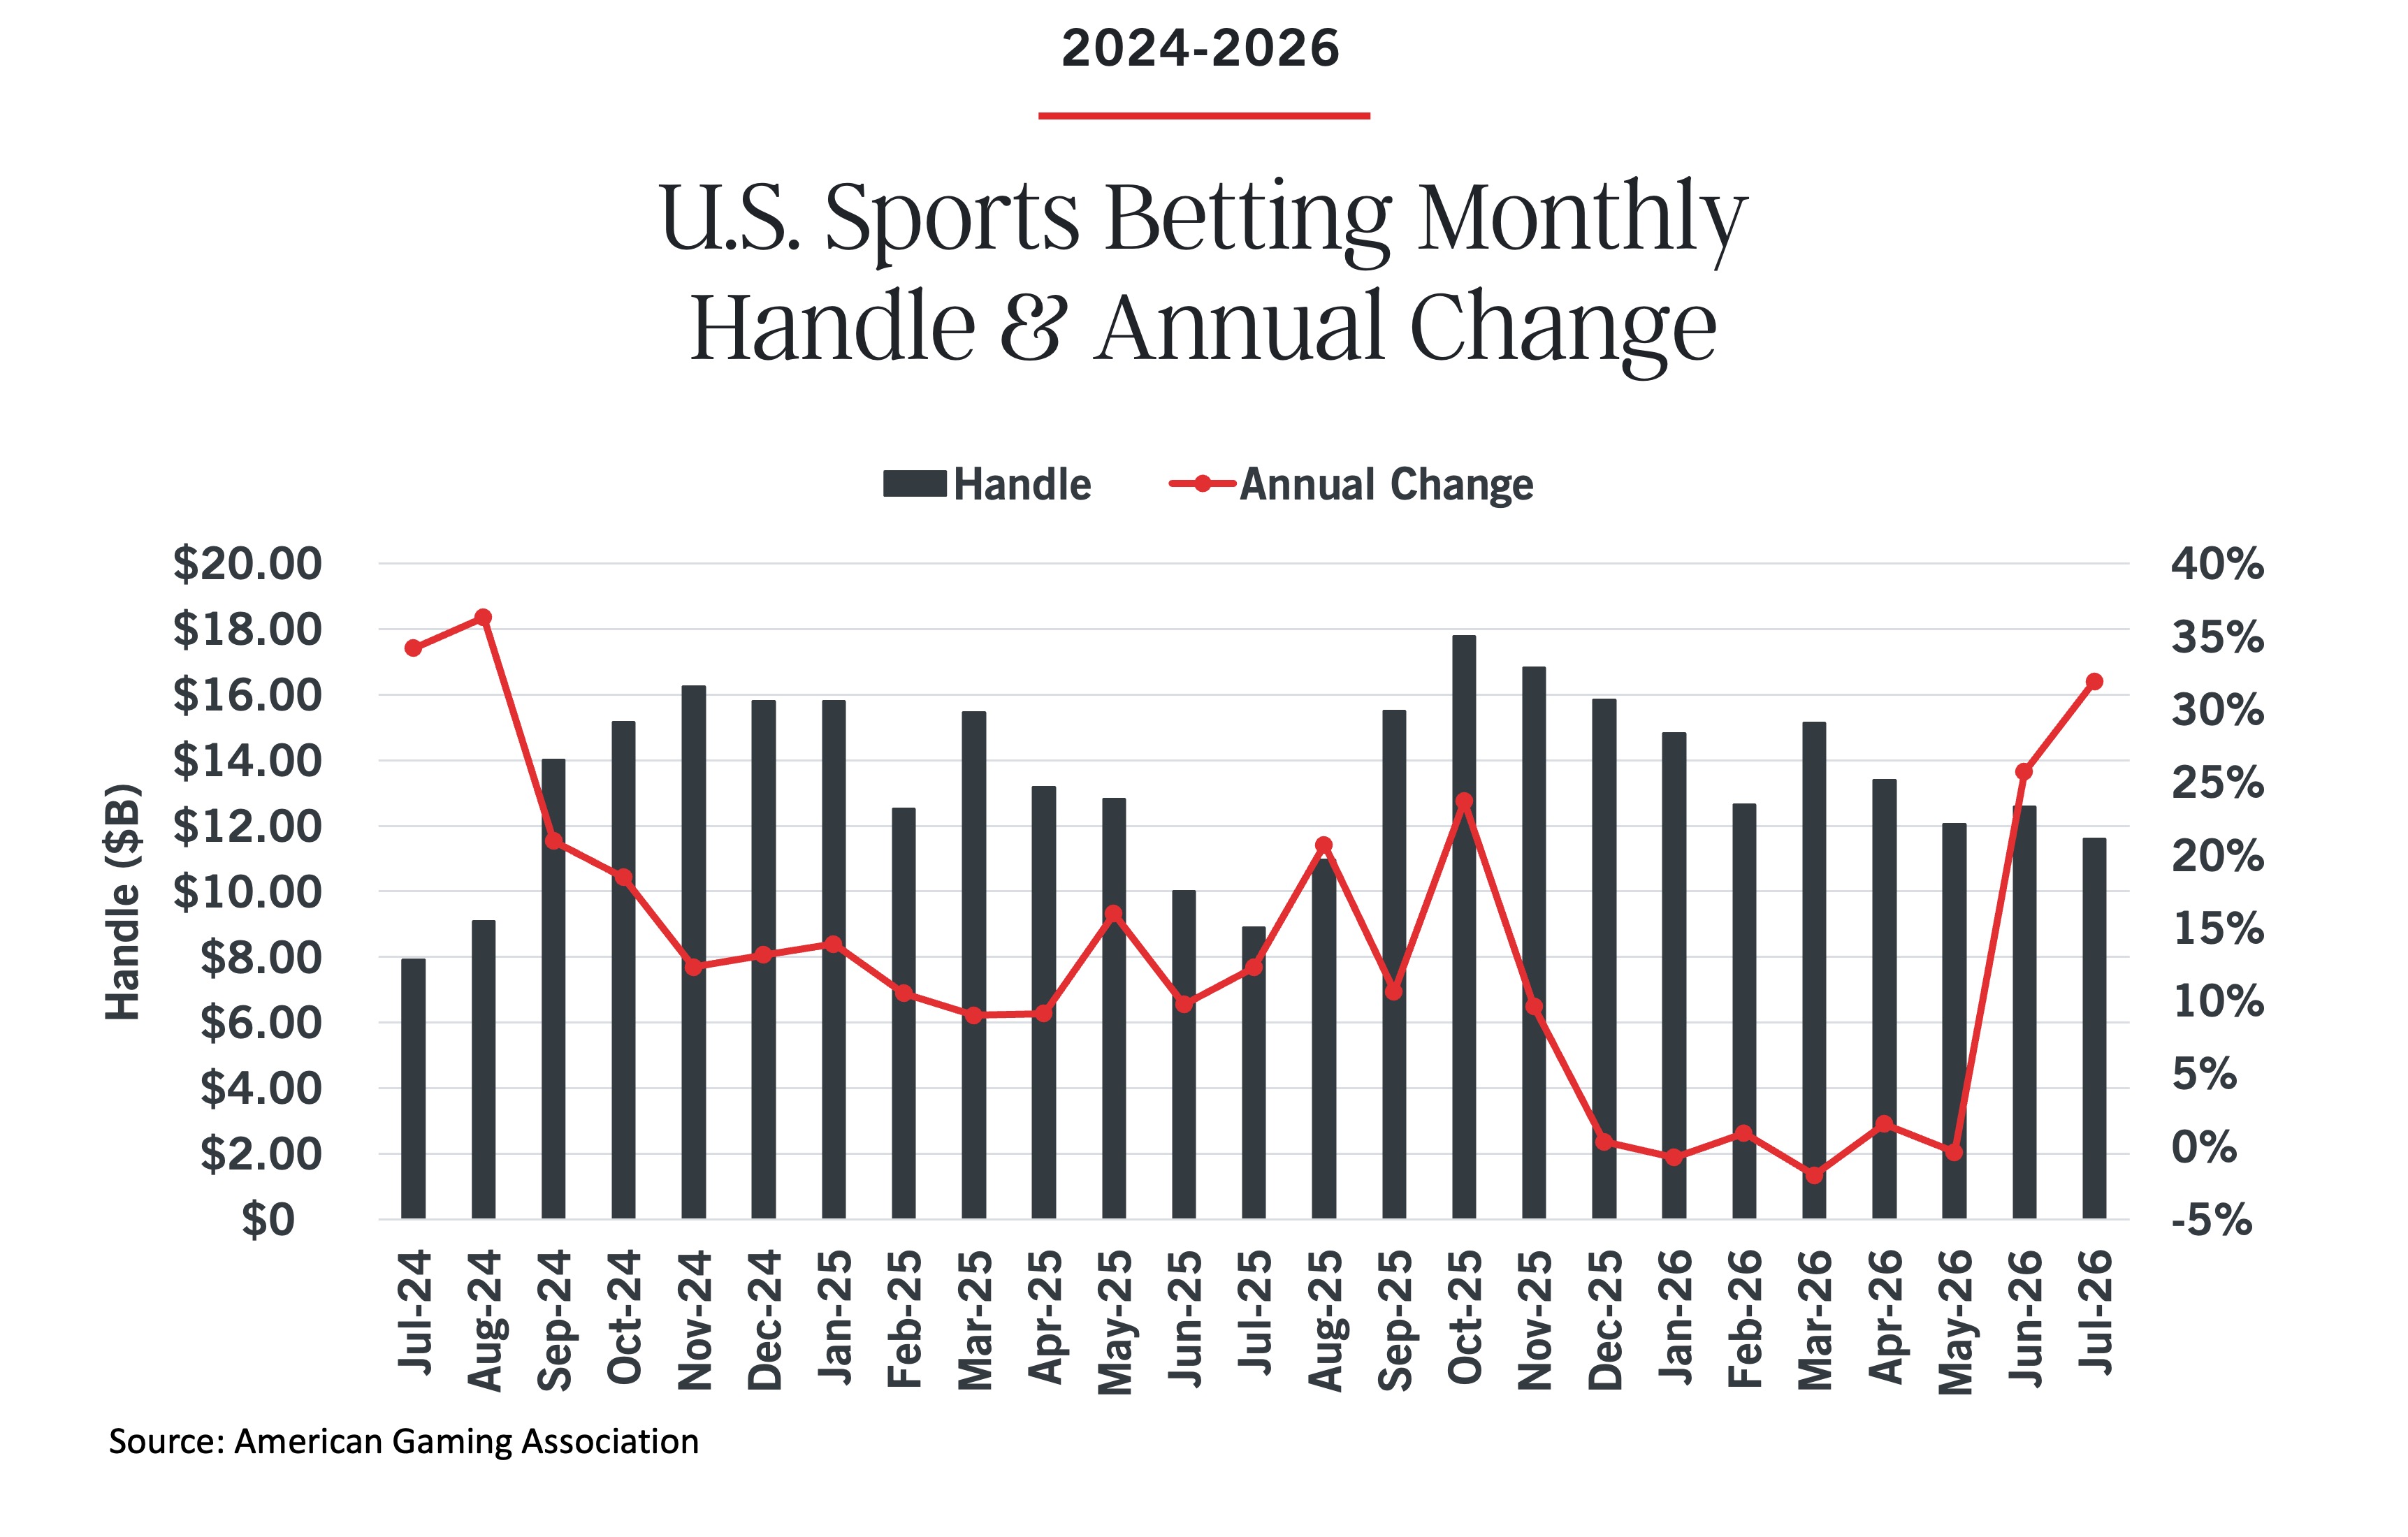
Sports betting revenue grew 27.0 percent in July to $1.27 billion on a handle of $11.60 billion (+31.9%).
Despite a less favorable hold than in July 2025, the World Cup provided a significant boost in handle and revenue following months of near zero handle growth dating back to December of last year.
iGaming generated $1.01 billion in July revenue, a 15.7 percent increase compared to the previous year. Showing signs of natural maturation with no new markets coming online, iGaming growth continues to steadily moderate.
State Budget Impacts: Regulated gaming generated $1.42 billion in gaming tax revenue for vital state programs for July, up 7.7% from last year. This figure could have been significantly higher but was negatively impacted by operators of skill machines, “sweepstakes casinos” and those offering illegal sports betting through prediction market platforms, none of which pay state gaming taxes.
Prediction market platforms offering backdoor sports bets have cost state governments an estimated 1.5 billion dollars in potential gaming taxes since the start of 2025, depriving seniors’ pension plans and responsible gaming programs, among other victims, of critical funding.