State of the States 2025
The U.S. commercial gaming industry generated record-breaking revenue for a fourth consecutive year in 2024, driven by strong growth in iGaming and mobile sports betting.
Annual U.S. Commercial Gaming Revenue
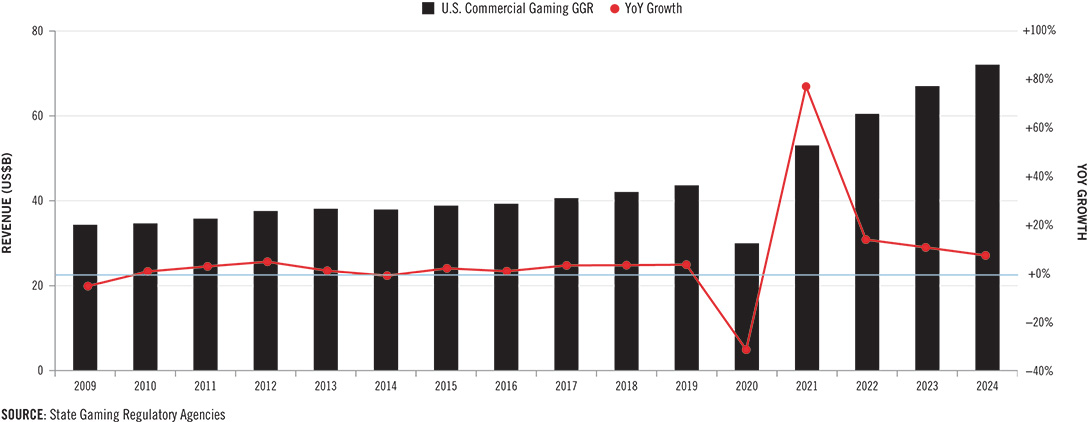
$72.04 Billion
in commercial gaming revenue in 2024, 7.5% higher than 2023.
28 of 38 States
set annual records for commercial gaming revenue.
$15.91 Billion
in gaming tax revenue generated by commercial gaming and paid to state and local governments.
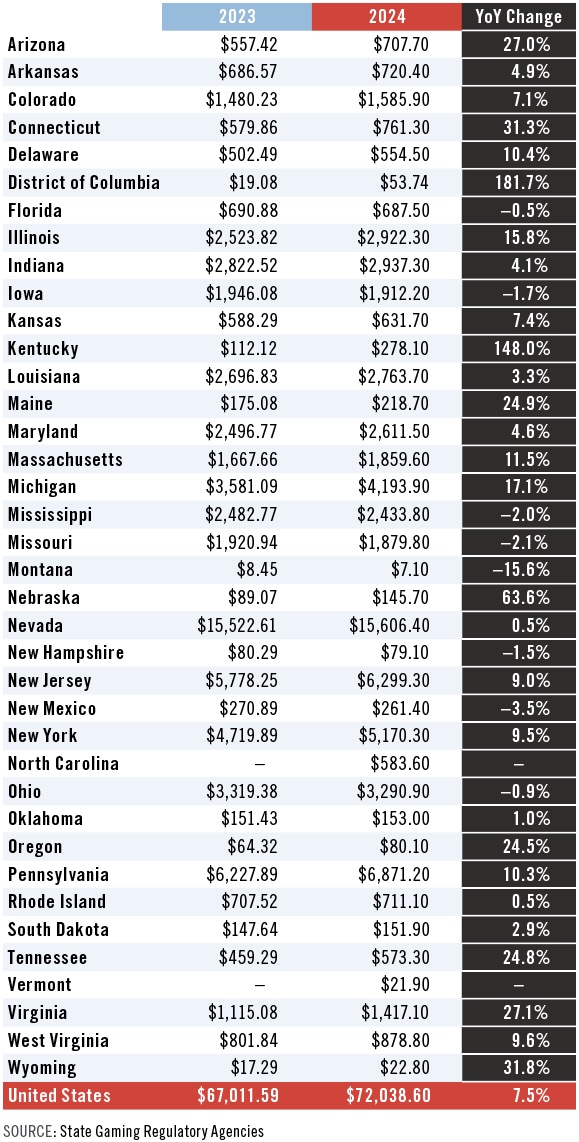
In 2024, 28 of the 38 jurisdictions with commercial casinos, iGaming or sports betting operations not only saw a rise in annual gaming revenue but also set all time annual revenue records. Notably, North Carolina and Vermont reported commercial gaming revenue for the first time after their regulated markets for mobile sports betting were launched during the course of the year.
Commercial Casino Gaming Consumer Spend by State 2023 vs. 2024
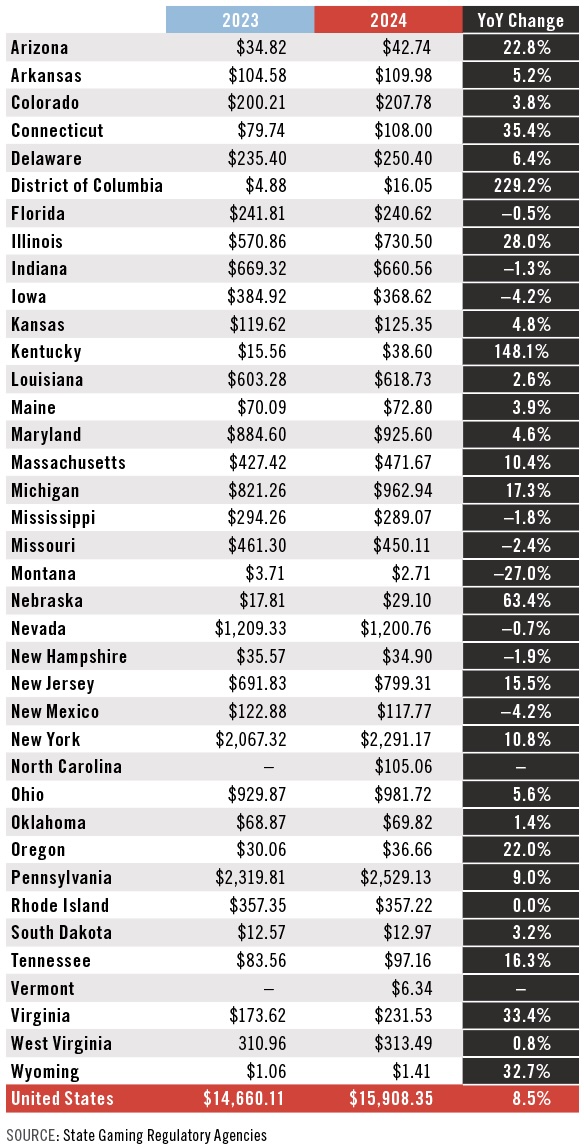
The increase in gaming revenue resulted in a record $15.91 billion of direct gaming tax revenue paid to state and local governments by commercial gaming establishments, an 8.5 percent increase compared to 2023. This figure just includes specific state and local taxes directly linked to gaming activities and does not include the billions of dollars more paid by the industry in the form of income taxes, sales taxes or various corporate taxes, nor does it incorporate the payroll taxes paid by gaming operators and suppliers. Federal excise tax payments made by sports betting operators are also excluded from the total.
Commercial Casino Direct Gaming Tax Revenue by State 2023 vs 2024
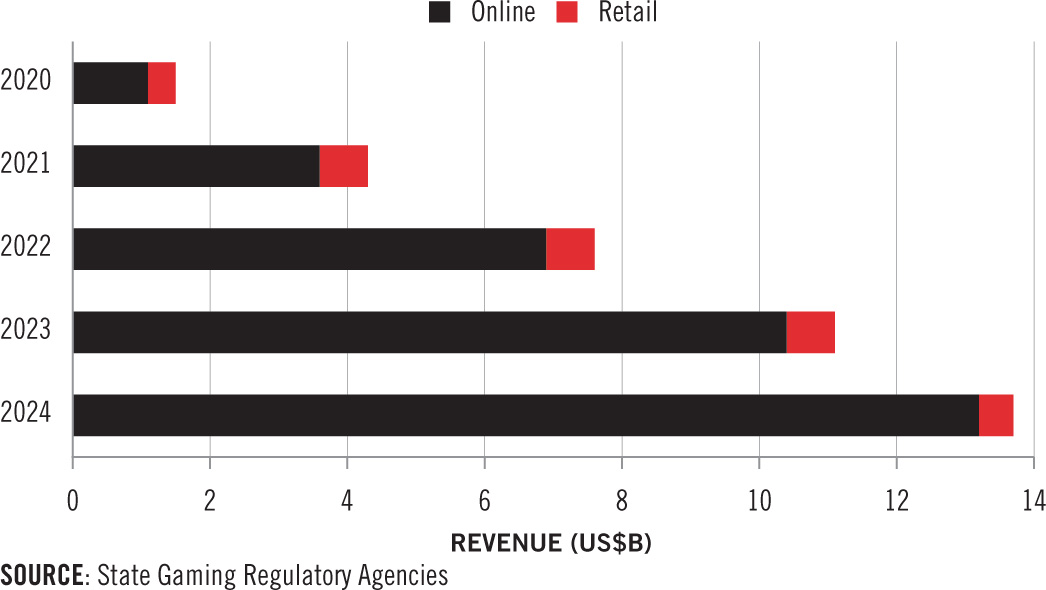
Across the 492 commercial casinos around the country, revenue from traditional casino games grew by one percent in 2024 to a record $49.89 billion.Legal sports betting launched in North Carolina and Vermont in 2024, helping drive commercial sports betting revenue up 24.8 percent to $13.78 billion as Americans legally bet a total of $149.90 billion on sports throughout the year.
The iGaming market also continued its strong growth in 2024, with combined iGaming revenue from seven active states (excluding Nevada’s online poker only market)reaching $8.41 billion, a 28.7 percent increase year-over-year. That total includes $26.3million in revenue from Rhode Island, which launched iGaming in March and was the first new market to open since Connecticut in late 2021.
Regulated Sports Betting Revenue – 2020 to 2024
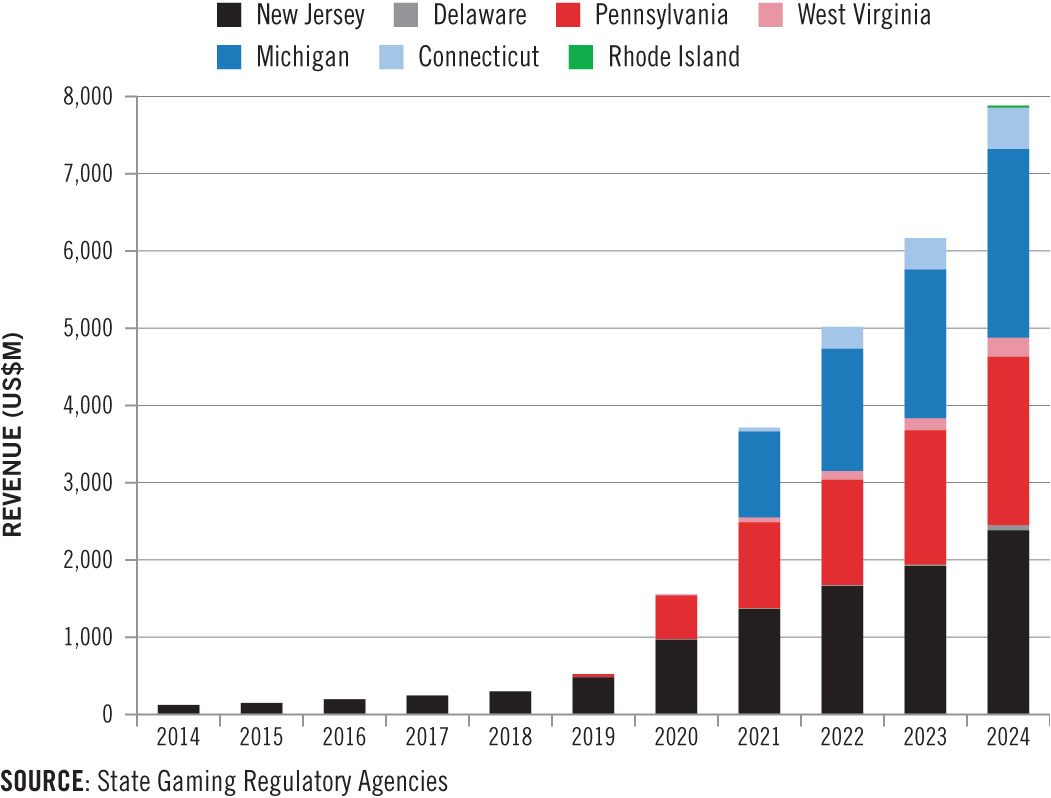
United States: Regulated iGaming Revenue – 2014 to 2024
About State of the States
AGA’s annual State of the States report details the commercial gaming industry’s financial performance, including analyses of each of the 38 jurisdictions with commercial gaming operations in 2024. The report, developed with VIXIO Regulatory Intelligence, also provides a breakdown of the legality of types of gaming and number of casinos by state, summarizes major gaming policy discussions, and previews opportunities and challenges for the industry. The companion State of Play map provides the report findings, as well as key regulatory and statutory requirements for each state, in an easy-to-use, interactive tool.