Commercial Gaming Revenue Tracker
The American Gaming Association’s (AGA) Commercial Gaming Revenue Tracker features state-by-state and nationwide financial performance data with breakdowns for individual gaming verticals.
TOPLINE INDUSTRY TRENDS
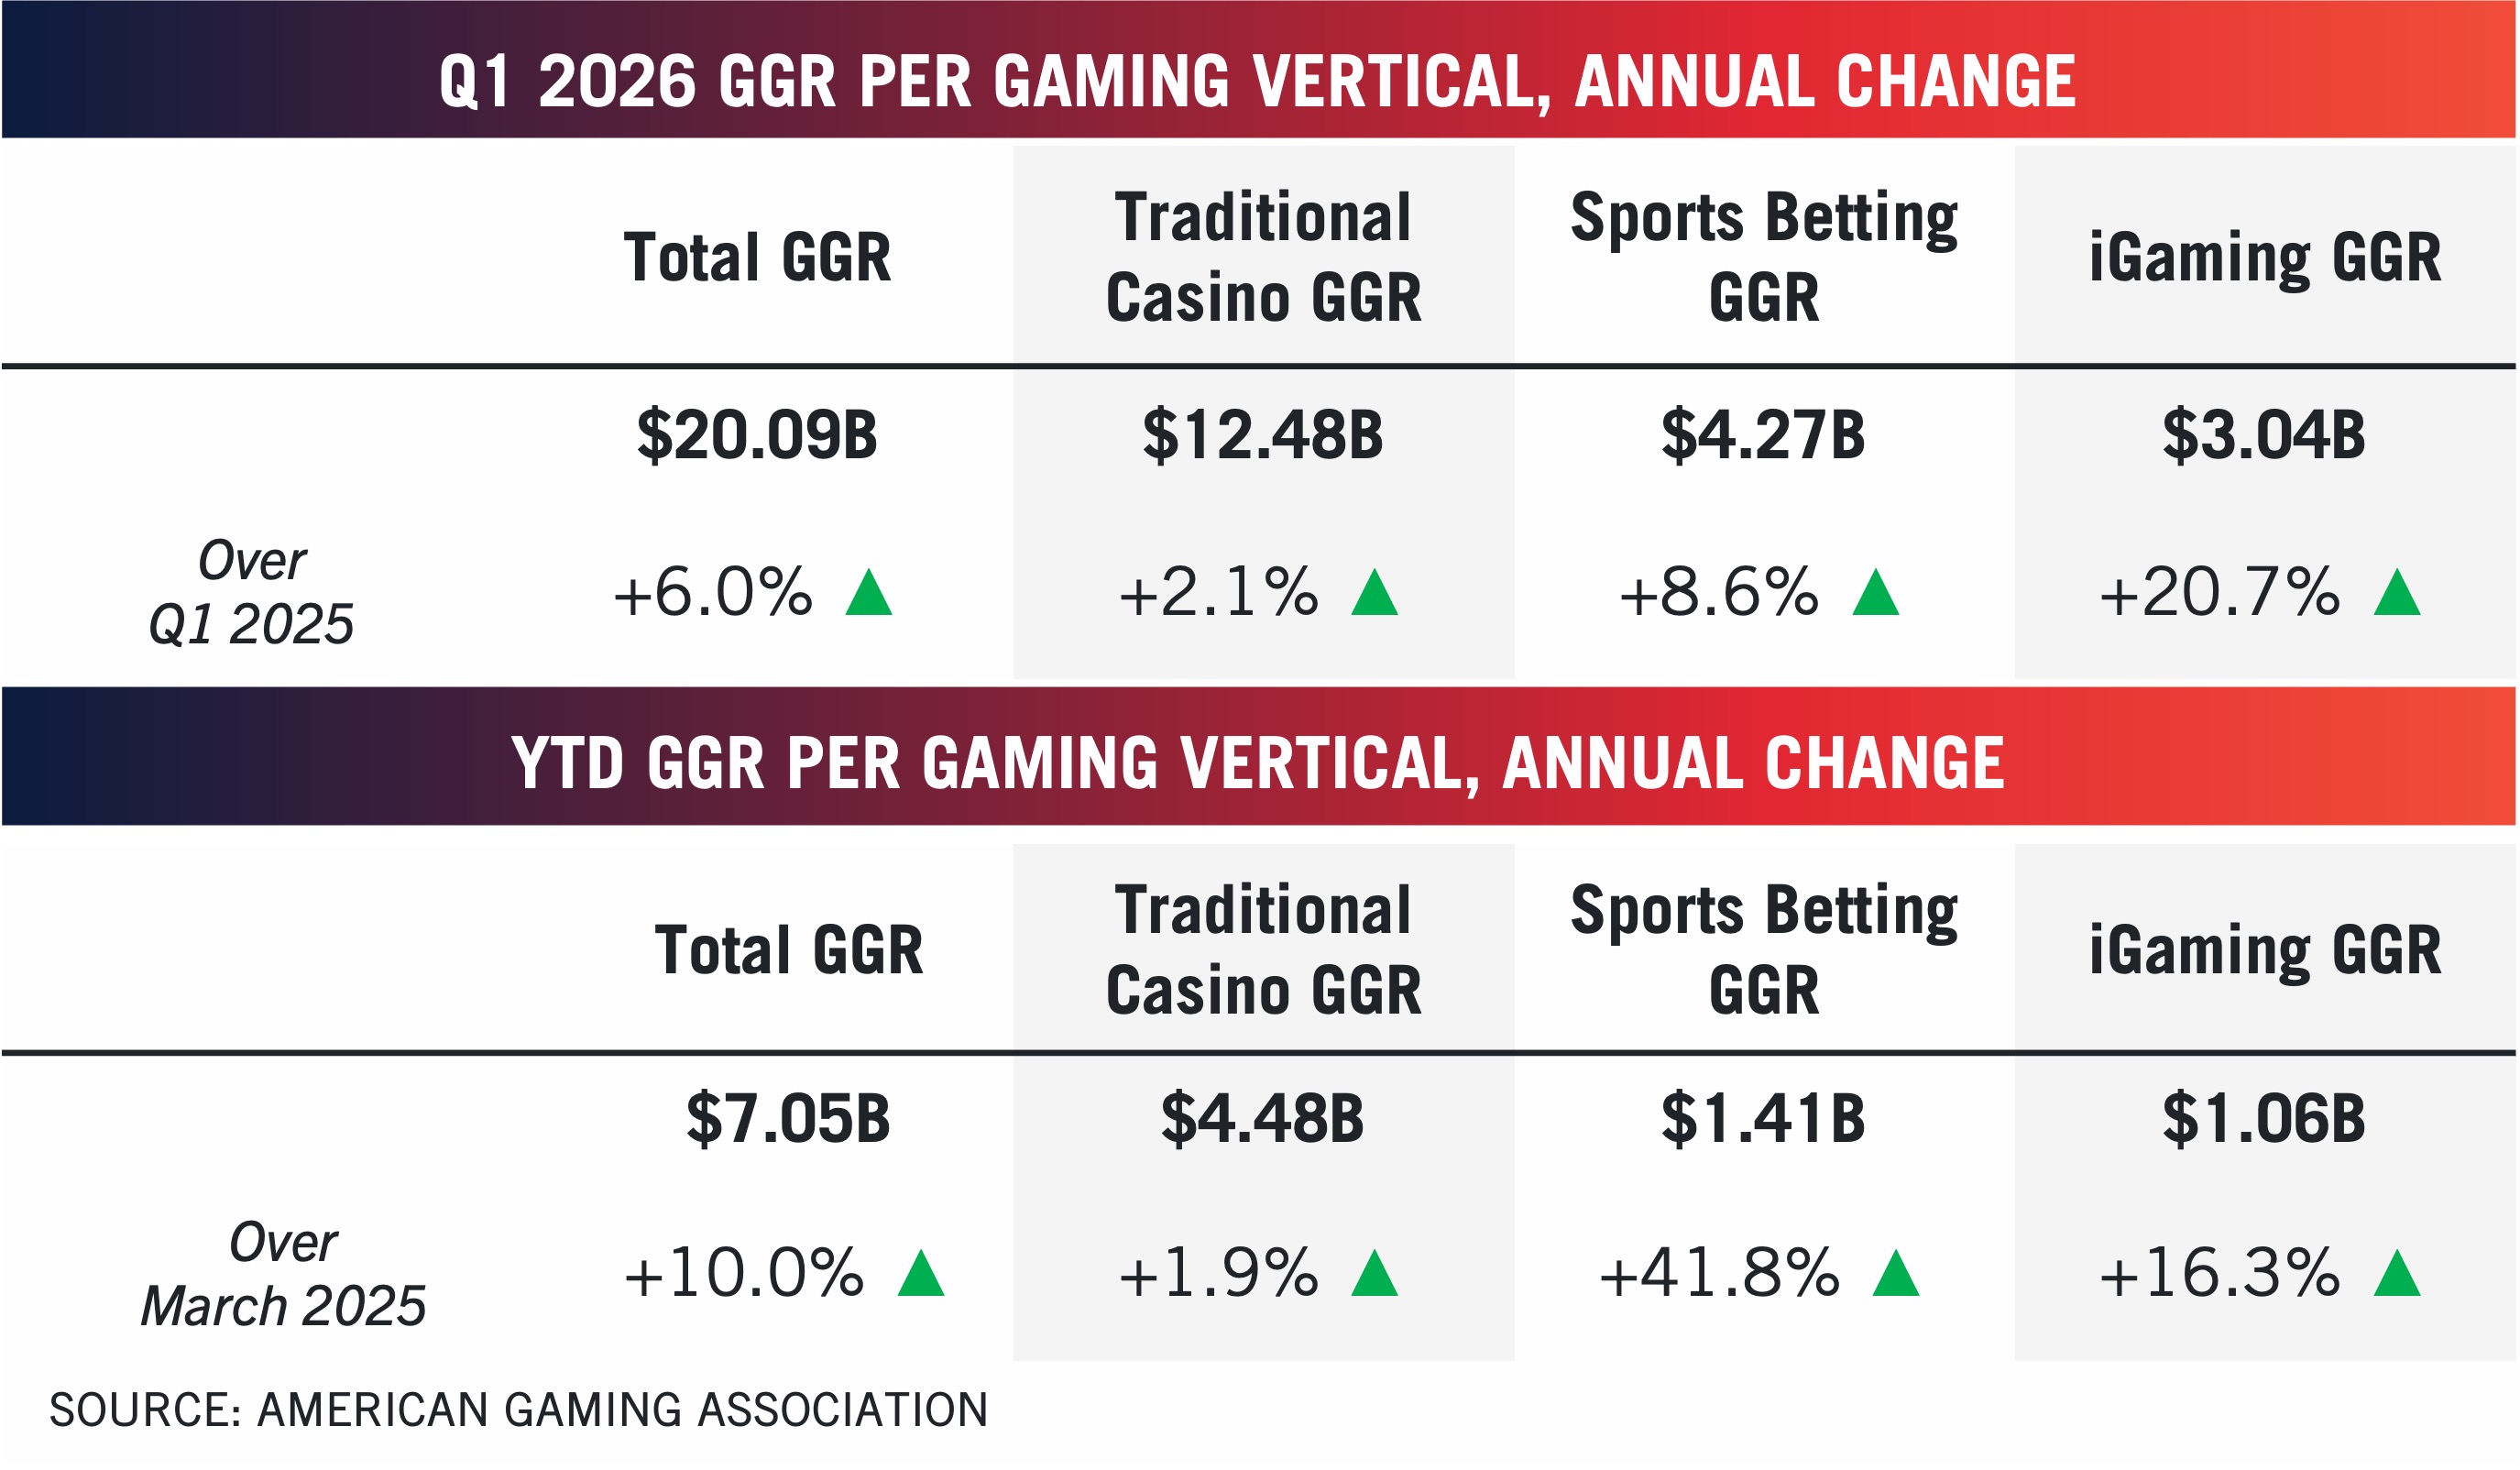
Strong Start to 2026: Commercial gaming revenue expanded across all three major verticals in the first quarter, reaching $20.09 billion, a 6.0% increase.
Q1 Ends on High Note: March commercial gaming revenue totaled $7.05 billion, a 10.0% year-over-year increase.
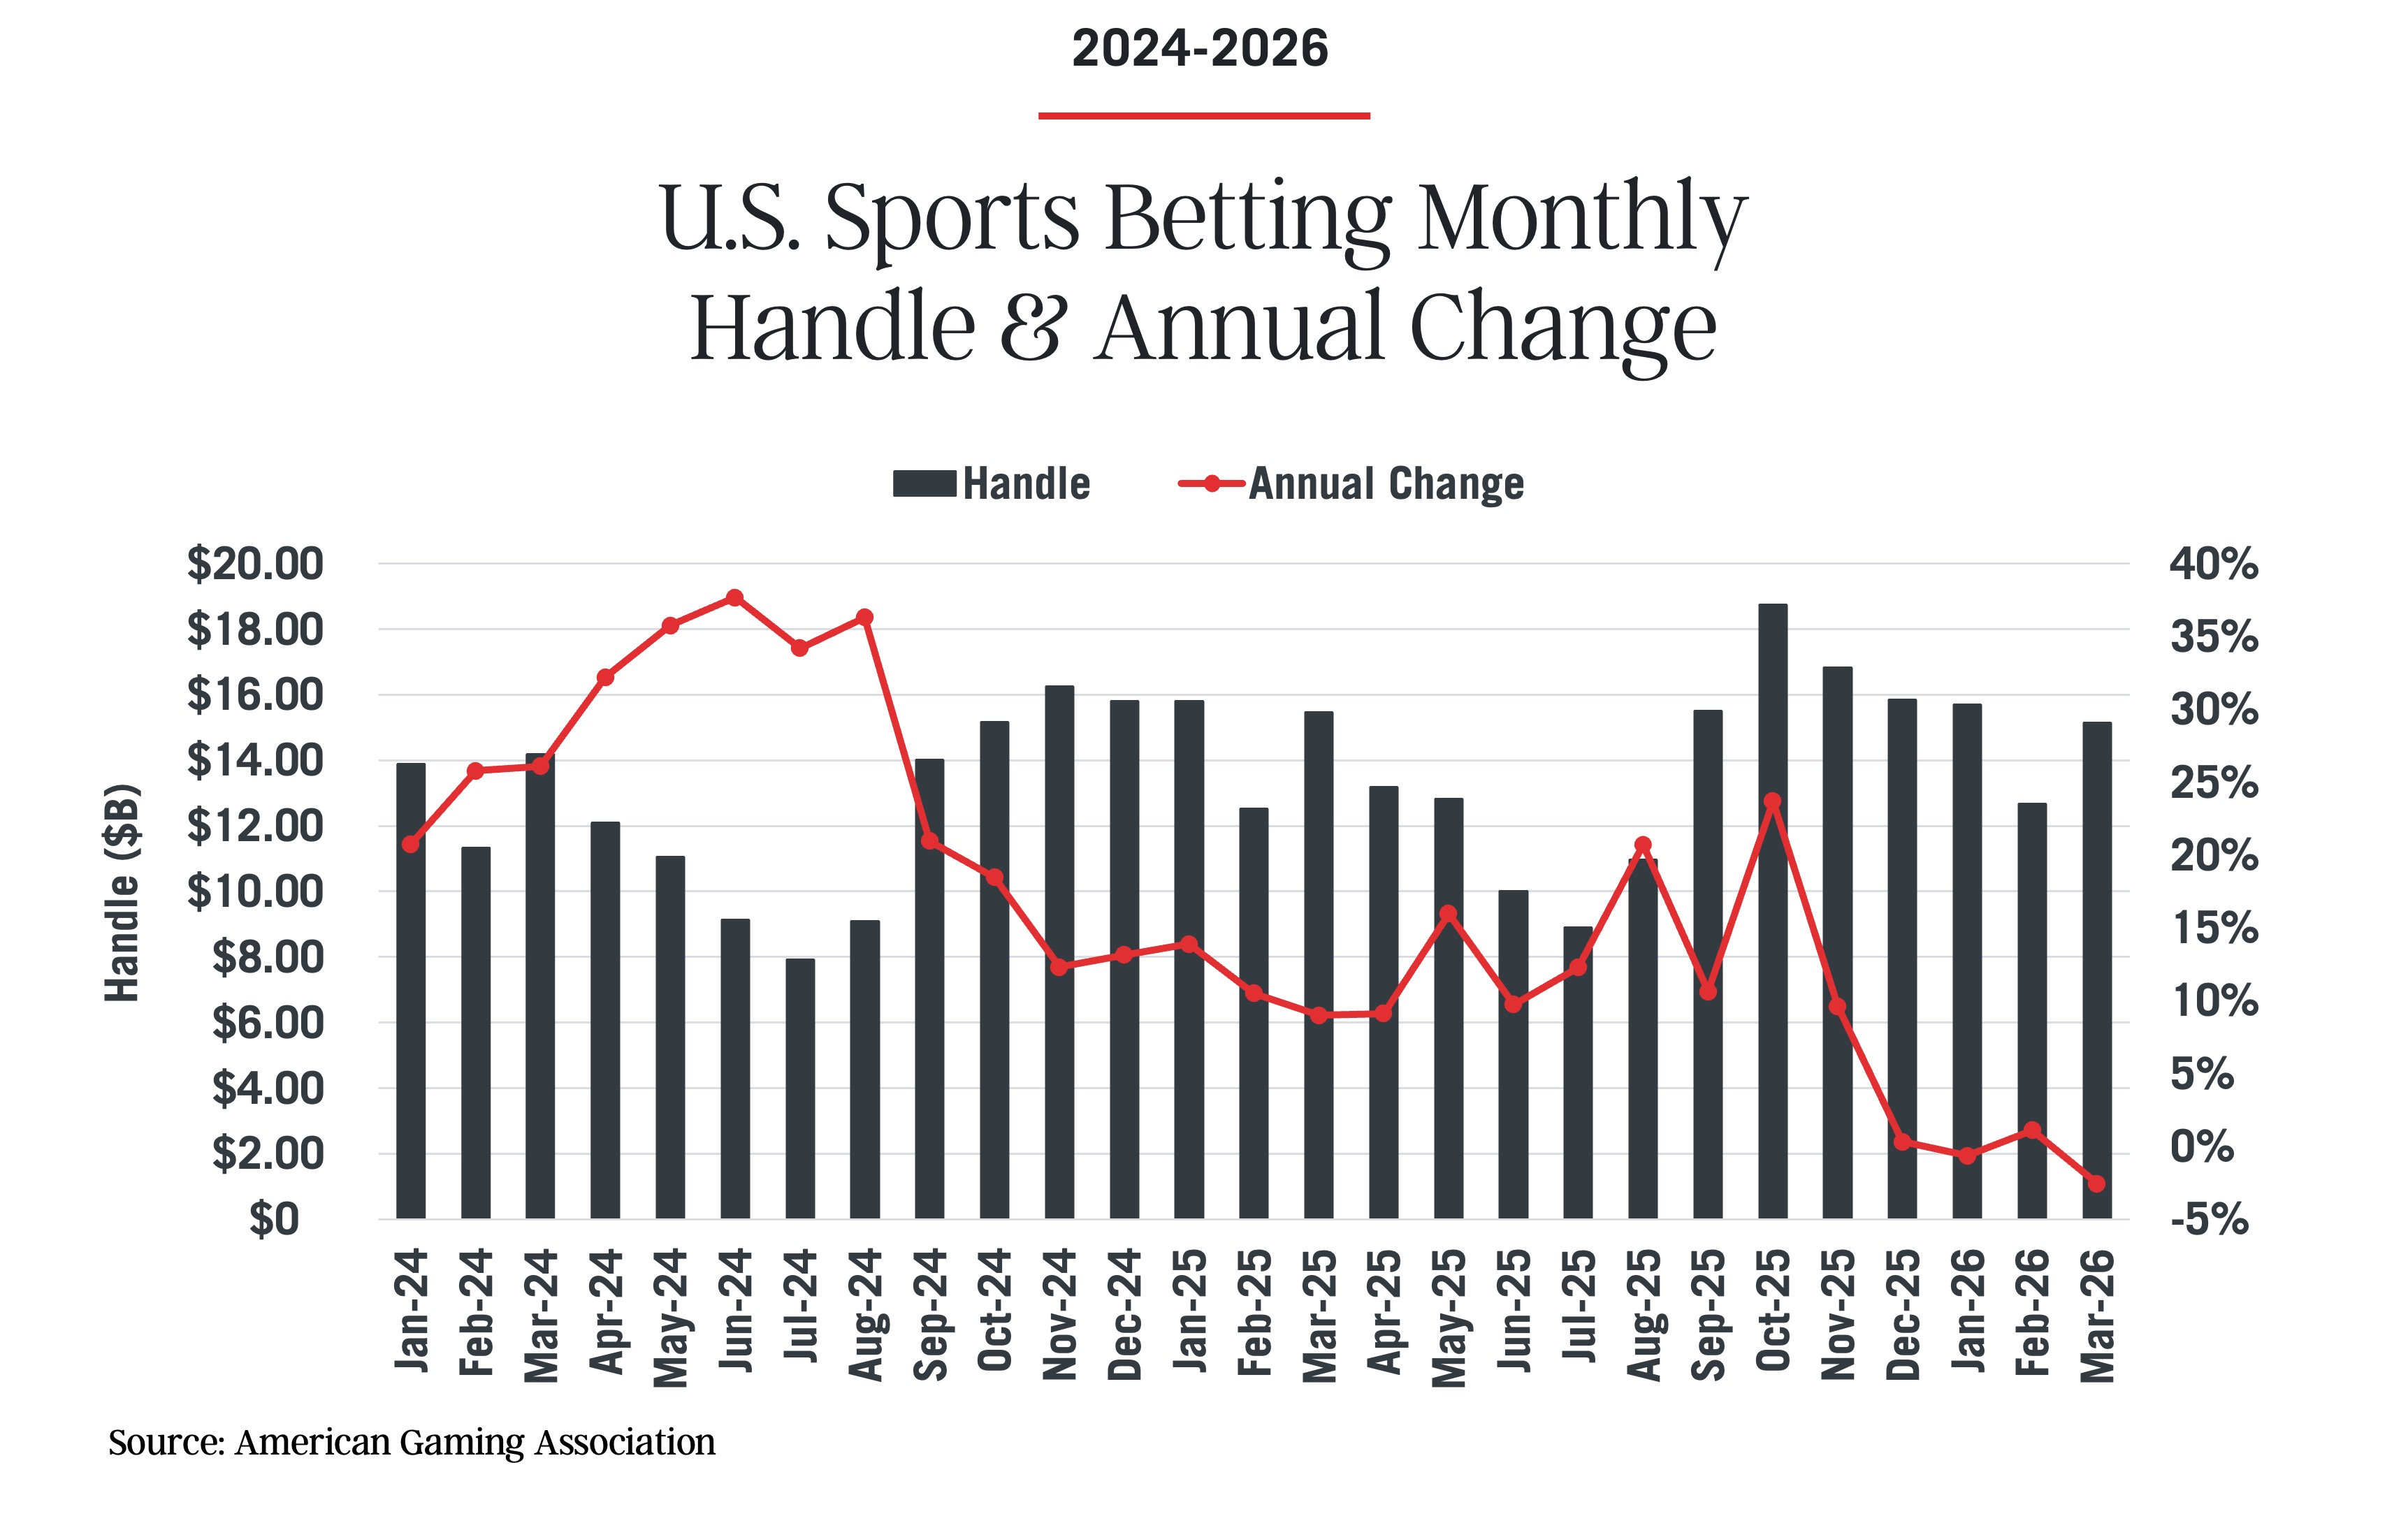
Handle Declines for the Second Month in 2026: March sports betting handle fell 2.6% and, through Q1, sports betting handle is down 0.8%. This marks the first quarter year-over-year handle decline since June 2020. Sports betting revenue rose 8.9% in Q1, driven by favorable hold comps.
![]()
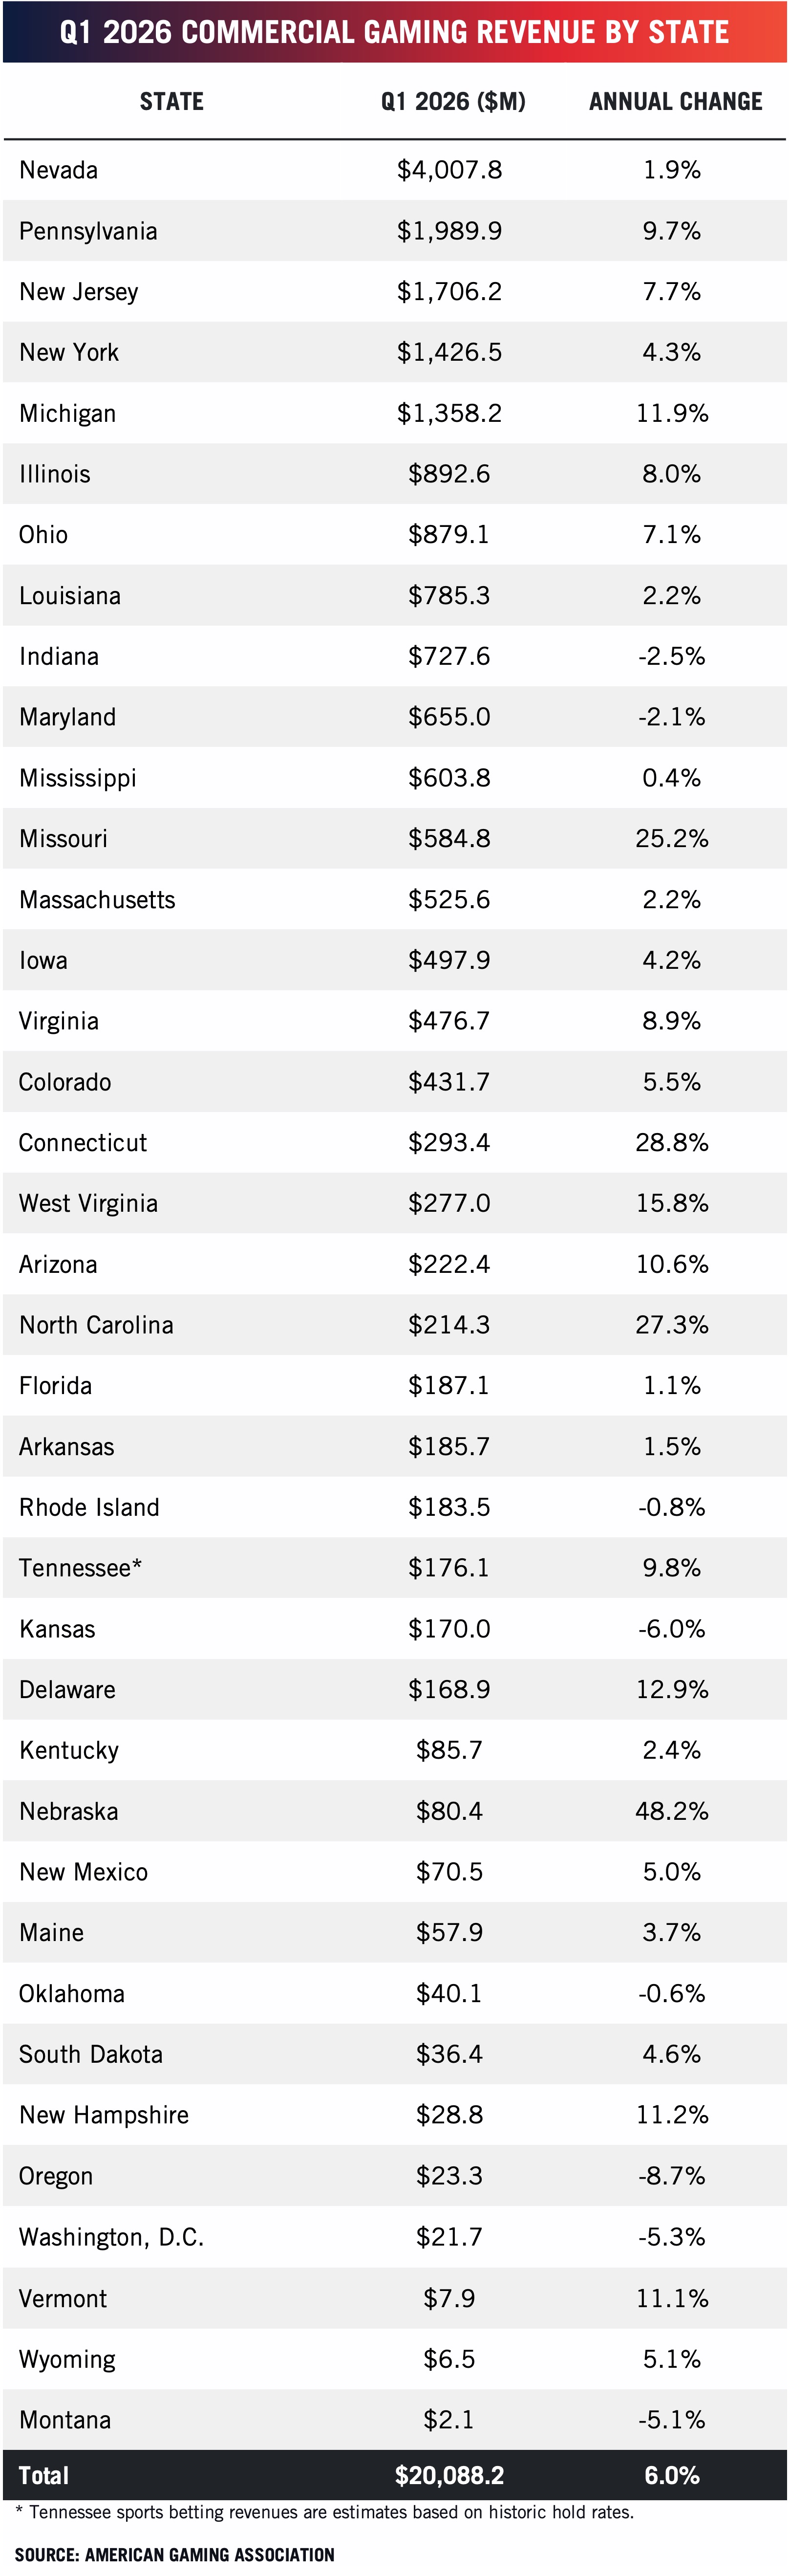
30 of 38 commercial gaming states saw annual commercial gaming revenue increases in Q1 of 2026.
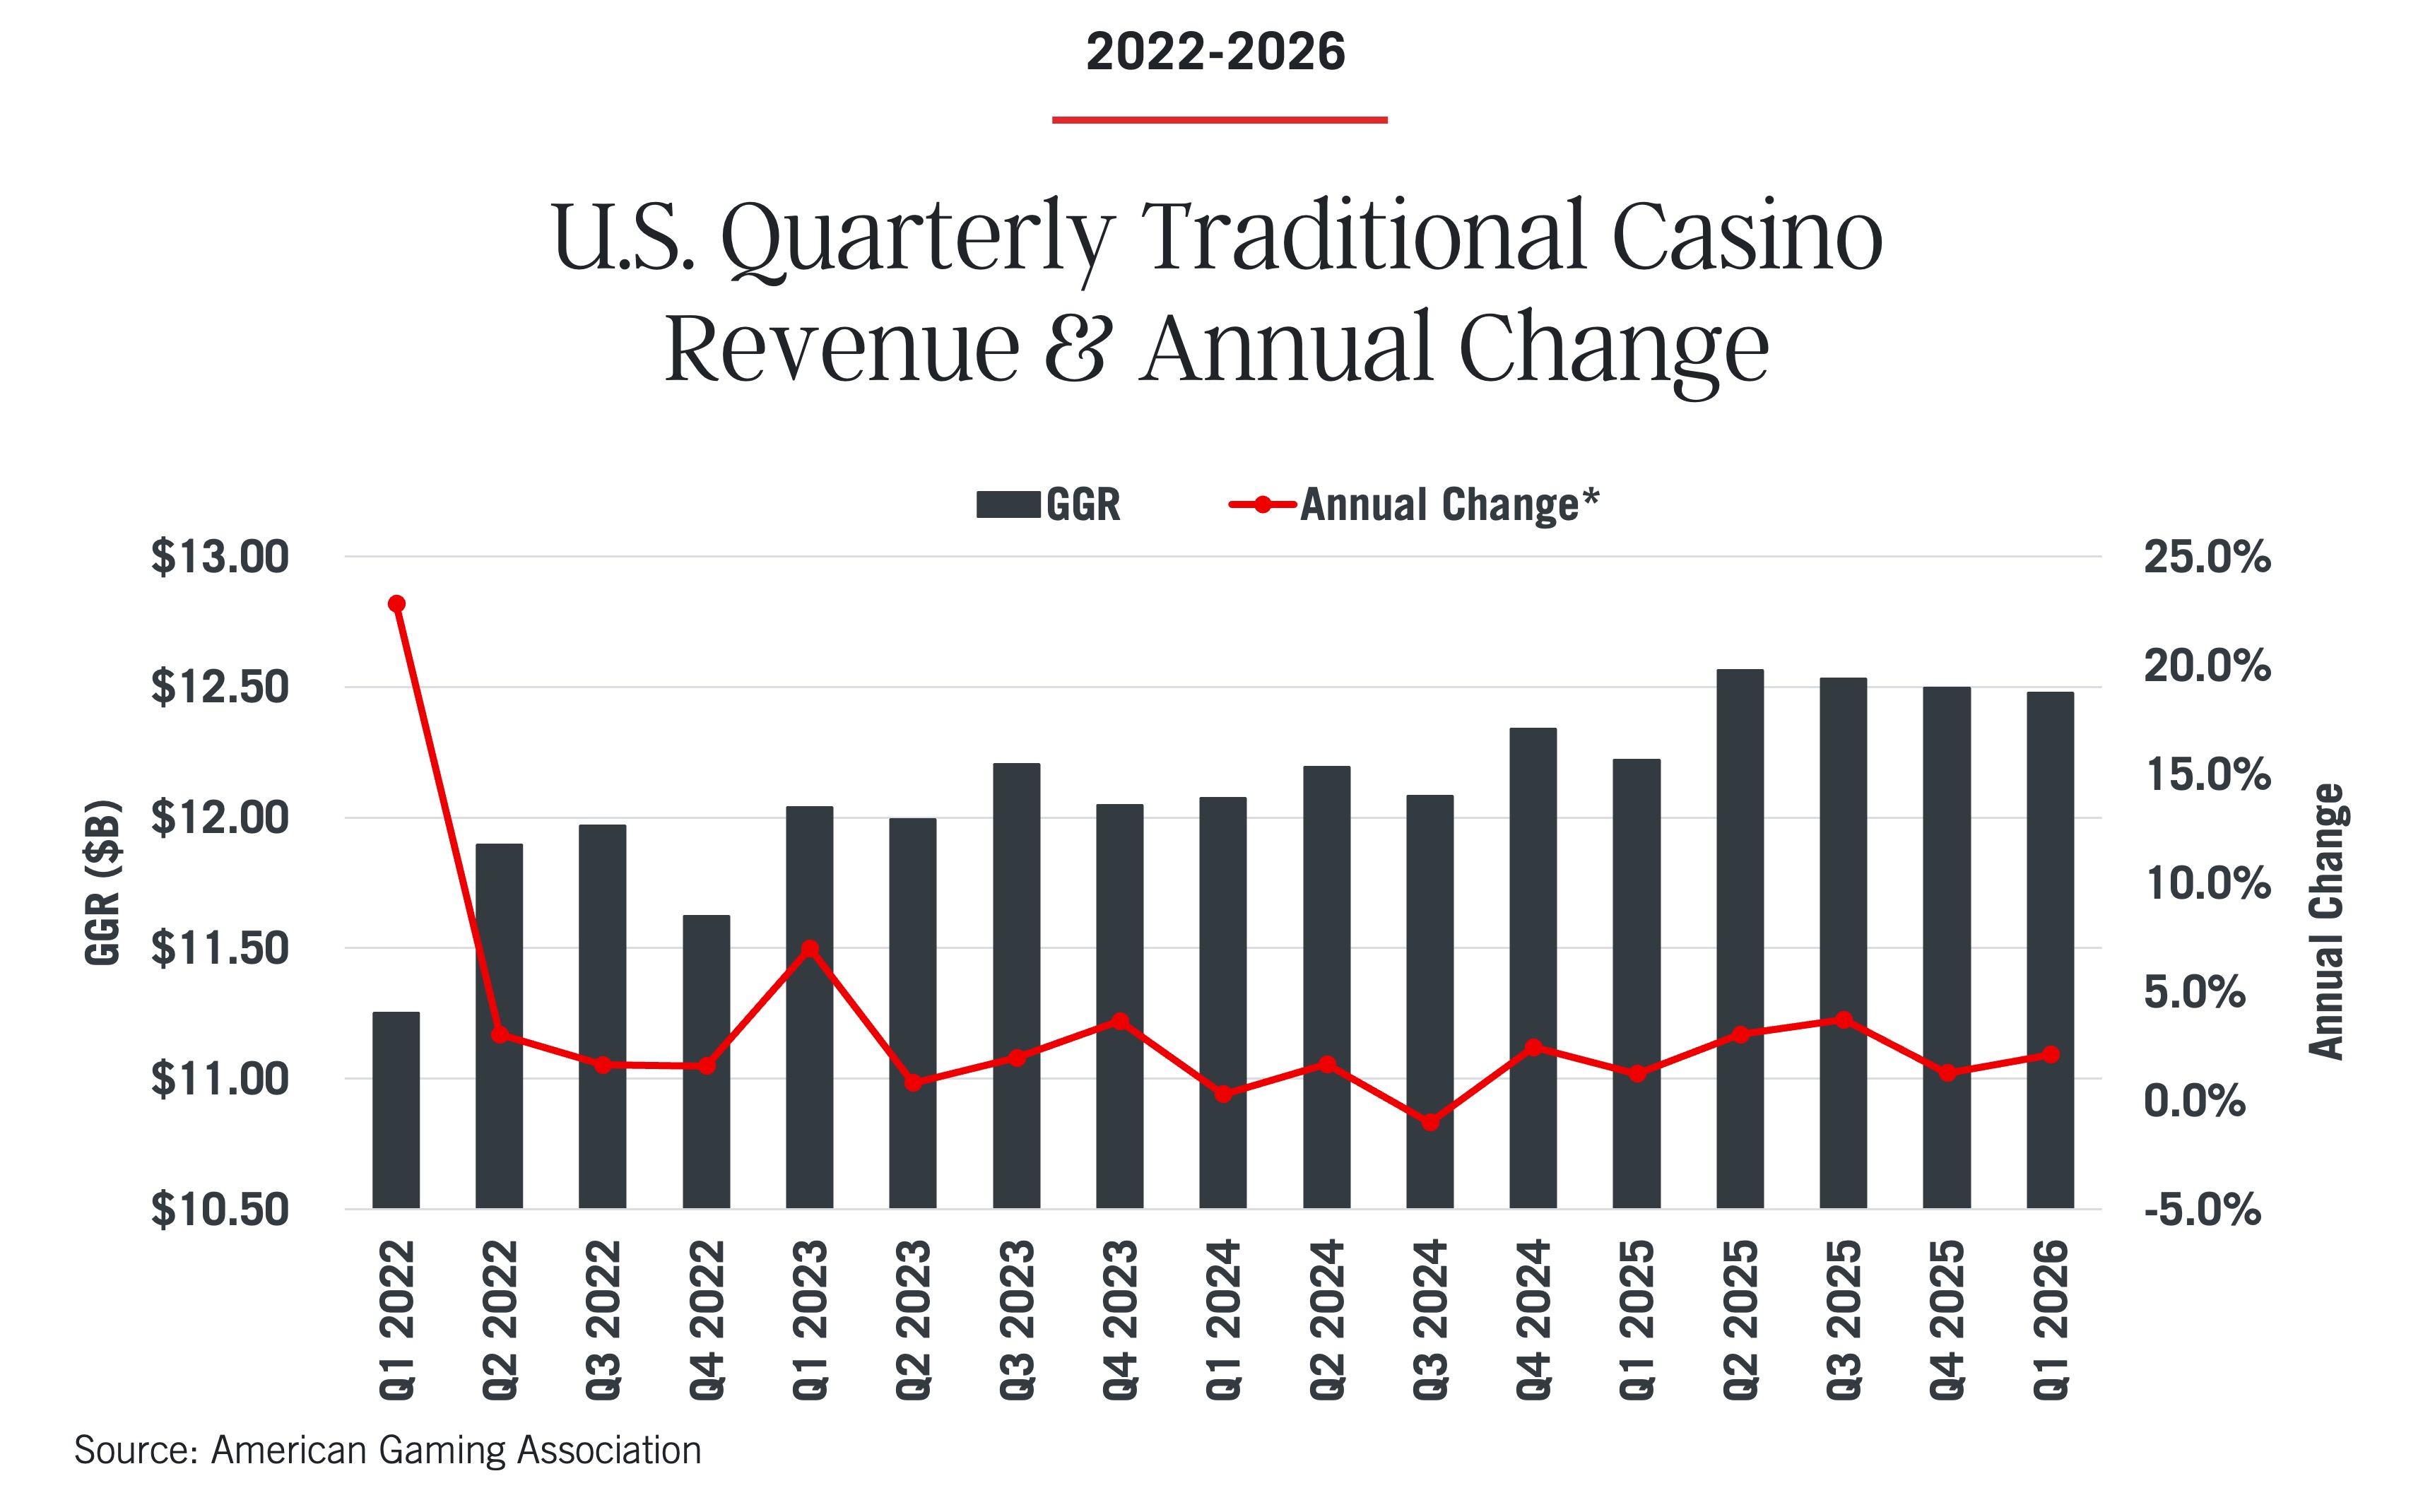
Traditional casino gaming expanded by 2.1 percent to $12.48 billion in the first quarter of the year. Although table game revenue was down 70 basis points in Q1, monthly table game revenue expanded for the second month in a row, with a 7.9% increase in March.
- Slot machines generated $9.30 billion (+3.1%) in Q1
- Table games revenue generated $2.50 billion (-0.7%) in Q1
$3.35 Billion
generated by slot machines in March 2026.
$881.1 Million
generated by table games in March 2026.
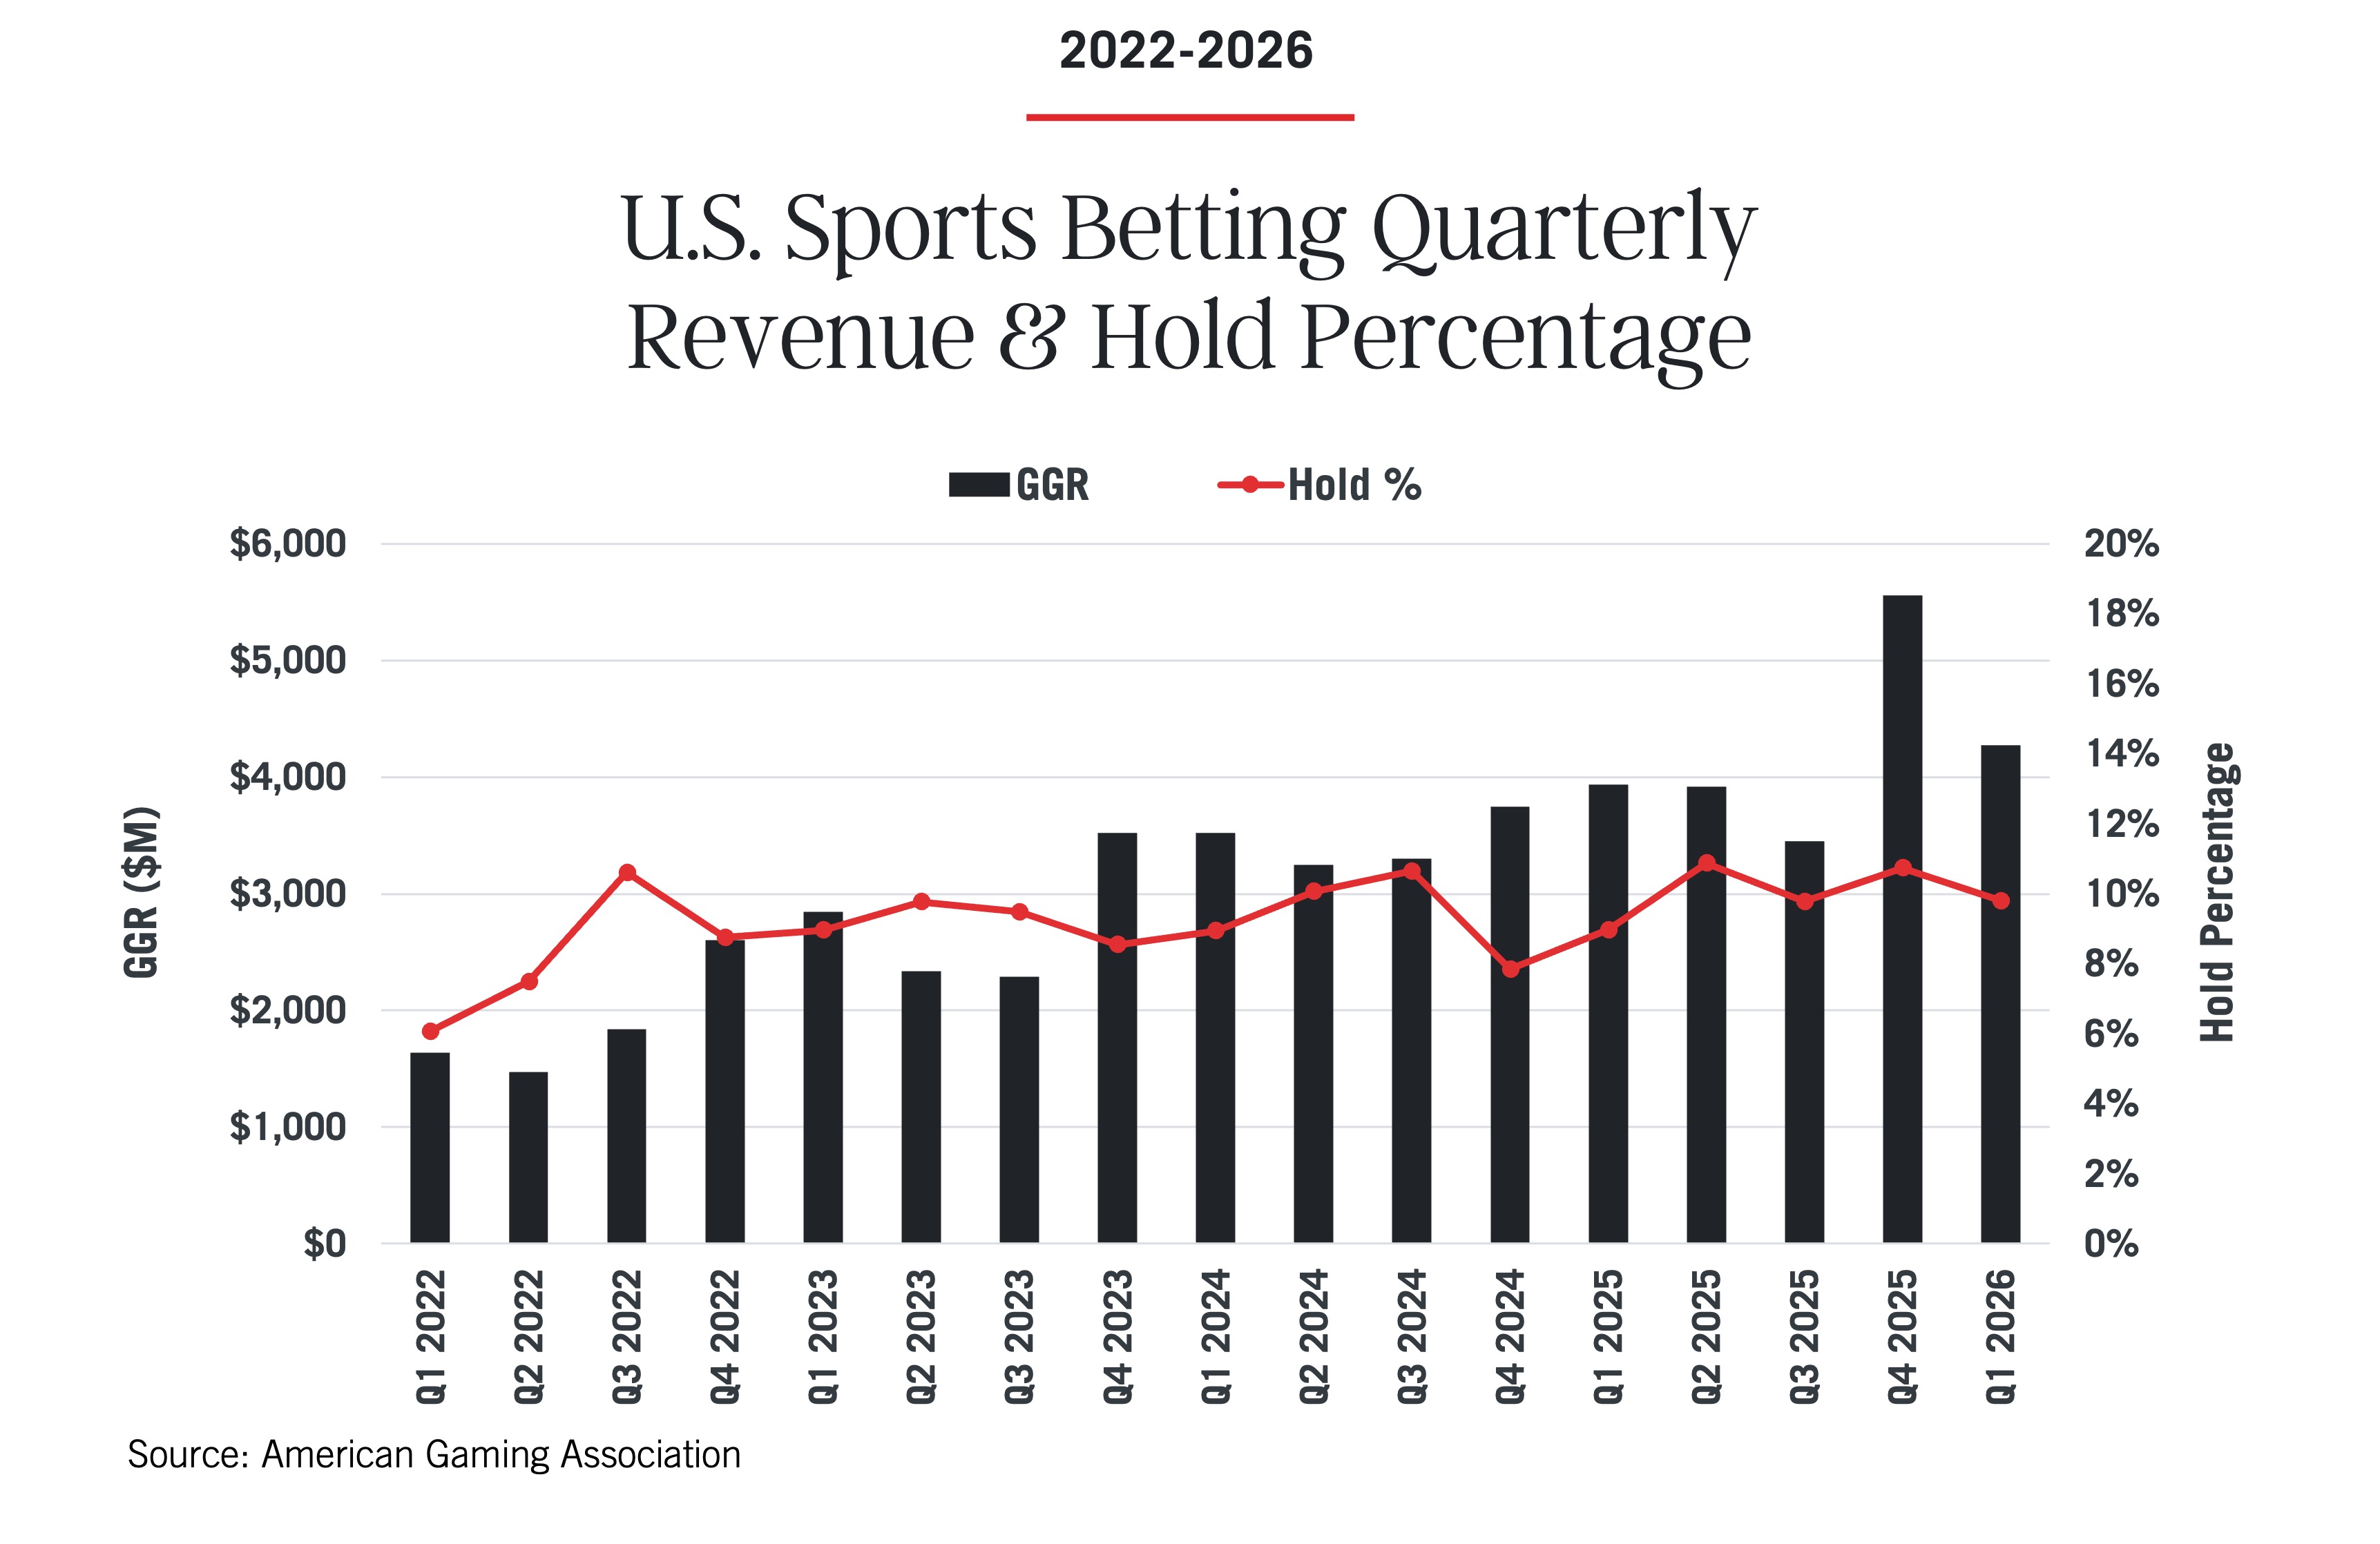
Sports betting revenue totaled $4.27 billion (+8.6%) in Q1 with a handle of $43.52 billion (-0.8%). The revenue increase was driven by a higher hold, which increased 85 basis points to 9.8% percent in Q1.
Benefiting from a favorable comparison last year, March hold increased nearly 300 basis points to 9.3%, driving a 42% increase in monthly revenue over March 2025, despite a 2.6% decline in handle.
Excluding the new market of Missouri, sports betting handle was down 4.7% in March and was 3.1% lower than Q1 2025. The March handle contraction was the largest since June 2020.
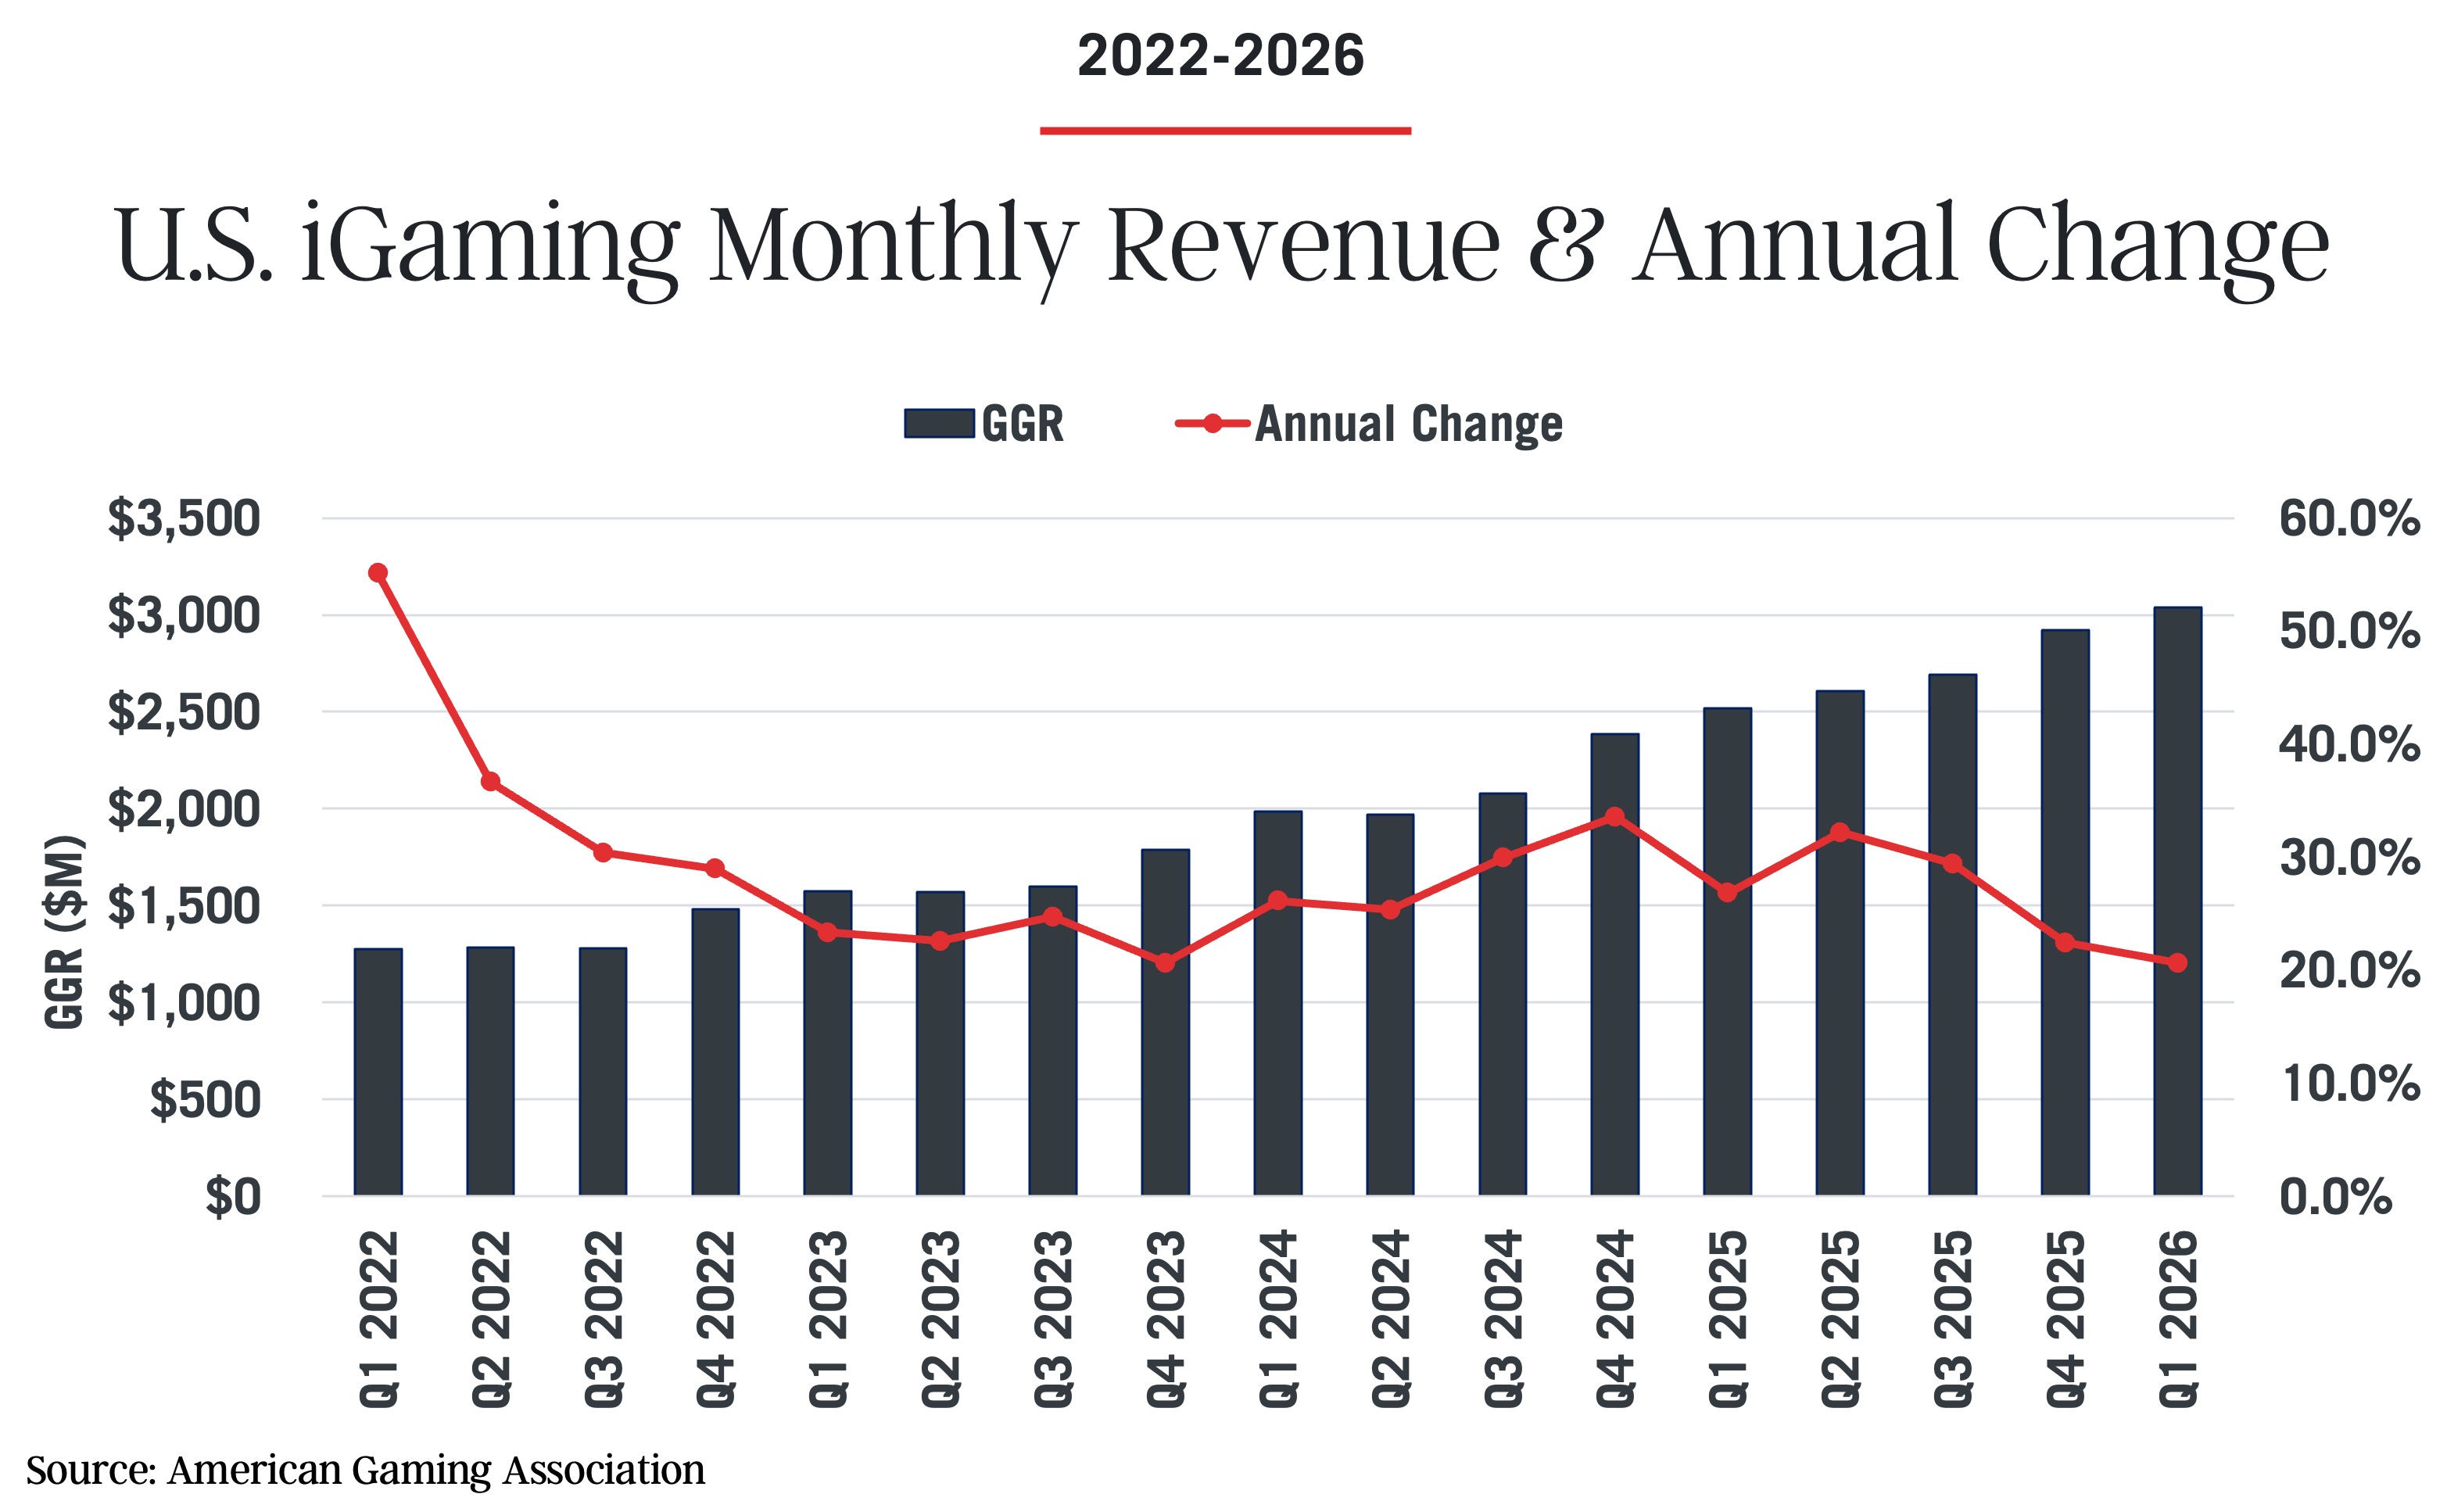
iGaming generated $3.04 billion in Q1 revenue, a 20.7 percent increase compared to the previous year. March iGaming revenue expanded 16.3 percent to $1.1 billion.
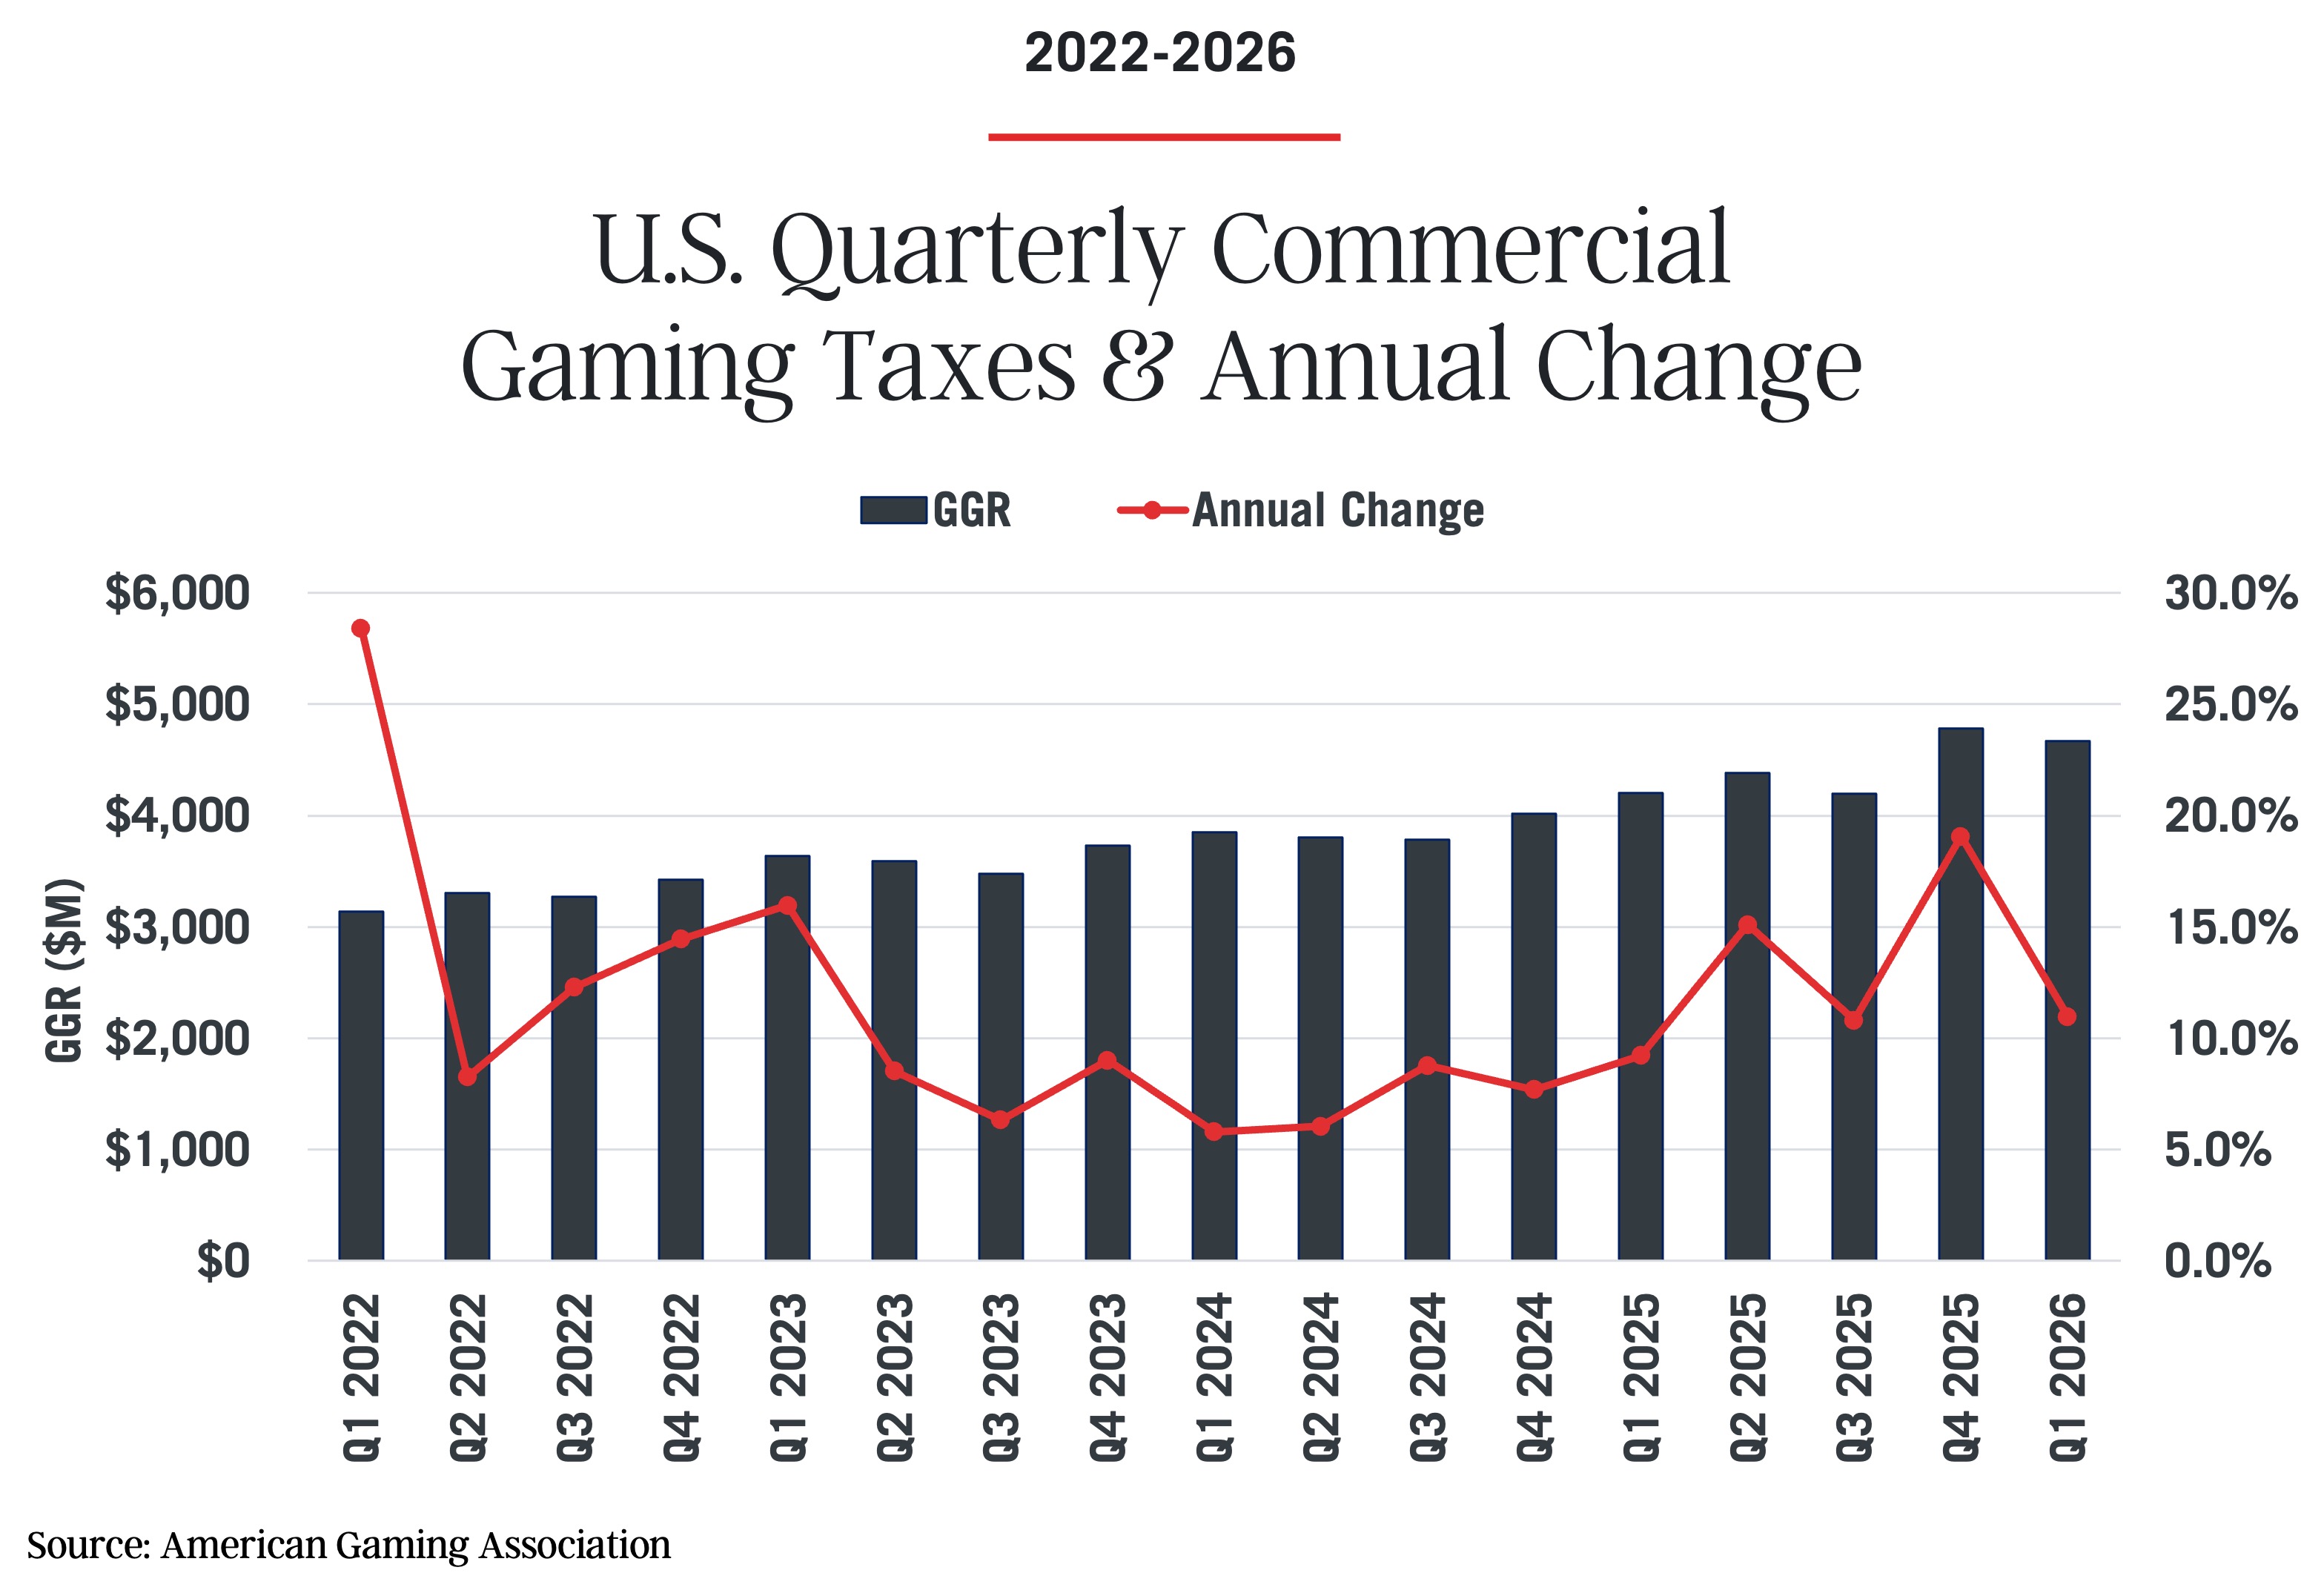
State Budget Impacts: Regulated gaming generated $4.67 billion in gaming tax revenue for vital state programs, a 11.0% increase in Q1 over last year. This figure could be significantly higher but is impacted by operators of skill machines, “sweepstakes casino” sites and those offering sports bets through prediction market platforms, none of which pay state gaming taxes.
Prediction market platforms offering sports bets may have cost state governments nearly $950 million in potential gaming taxes since the start of 2025, depriving seniors’ pension plans and responsible gaming programs, among other victims of critical funding.