State of the States 2026
The U.S. commercial casino gaming industry reported record-breaking revenue of more than $78 billion in 2025, driven by growth across the traditional land-based casino, sports betting and internet gaming markets.
Annual U.S. Commercial Gaming Revenue – 2011 to 2025
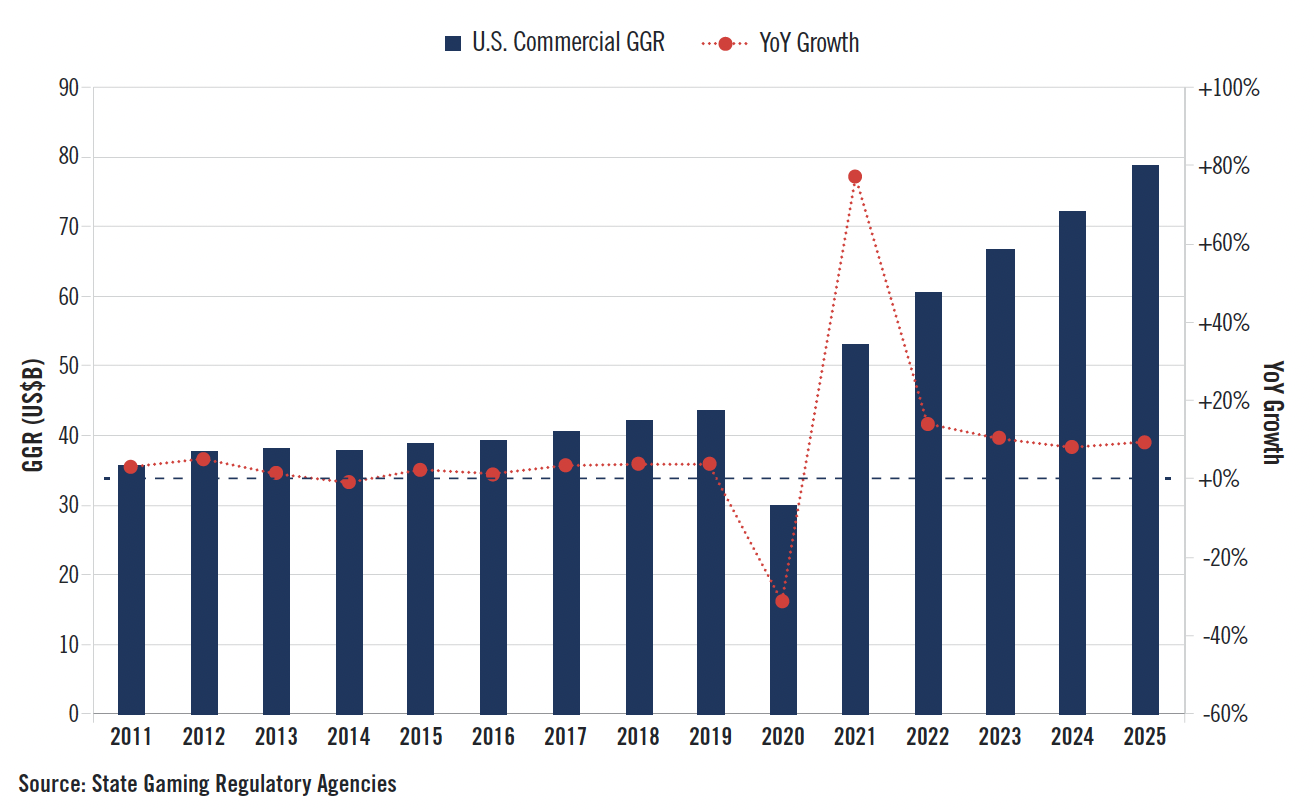
$78.62 Billion
in commercial gaming revenue in 2025, 9.1% higher than 2024.
34 of 38
States + D.C.
set annual records for commercial gaming revenue.
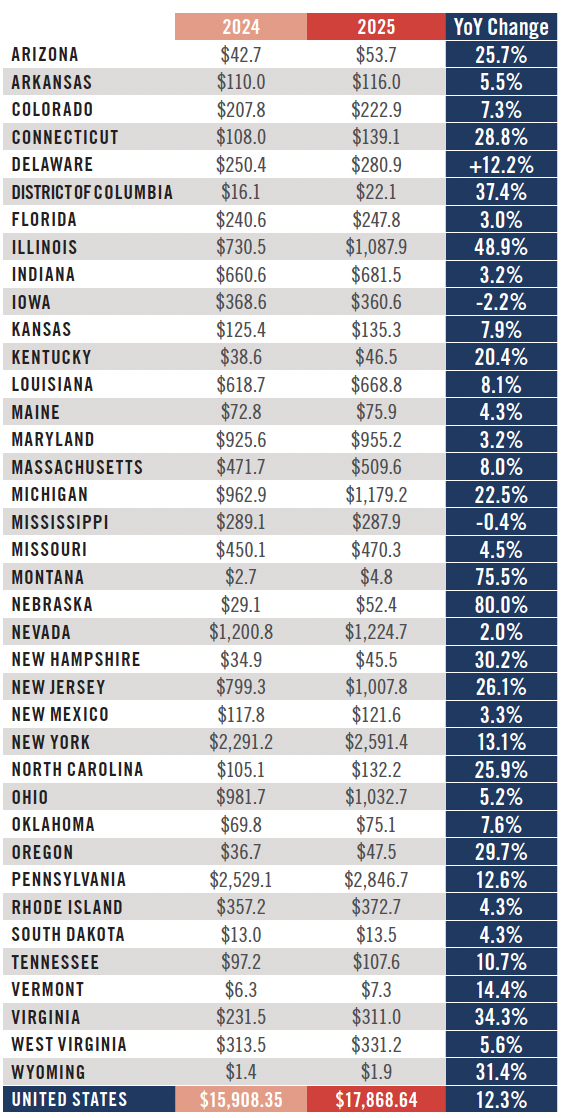
$17.86 Billion
in gaming tax revenue generated by commercial gaming, 12.3% higher than 2024.
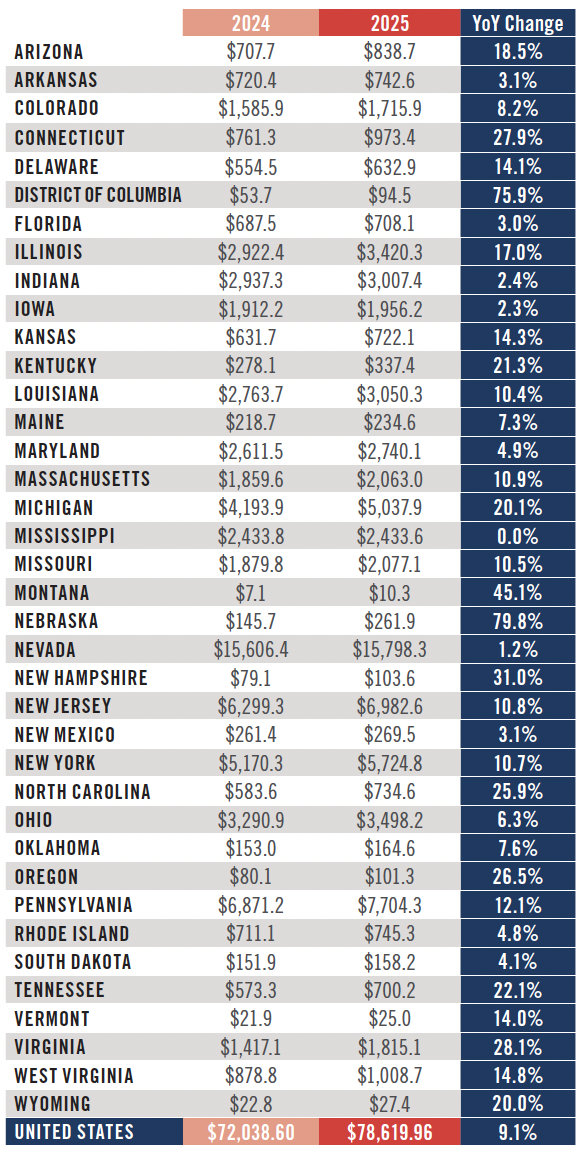
Overall, all but one of the 38 U.S. jurisdictions with commercial casino or sports betting operations reported an increase in gaming revenue, with total revenue in Mississippi down only a small fraction of a percent compared to 2024. Record annual commercial gaming revenue was reported by 34 states plus the District of Columbia in 2025.
Commercial Casino Gaming Consumer Spend by State
2024 vs. 2025
The record gaming revenue reported by commercial gaming operators resulted in a record total of $17.86 billion in direct gaming tax revenue paid to state and local governments and other beneficiaries. The tax total represented an increase of 12.3 percent from the prior year.
Notably, the $17.86 billion figure reflects only specific state and local taxes that are applied directly to gaming activities. It does not include the billions more paid by the industry in the form of income, sales, and various other corporate taxes, nor does the total reflect payroll taxes paid by gaming operators and suppliers. Also excluded are federal excise tax payments made by sports betting operations.
Commercial Casino Direct Gaming Tax Revenue by State
2024 vs. 2025
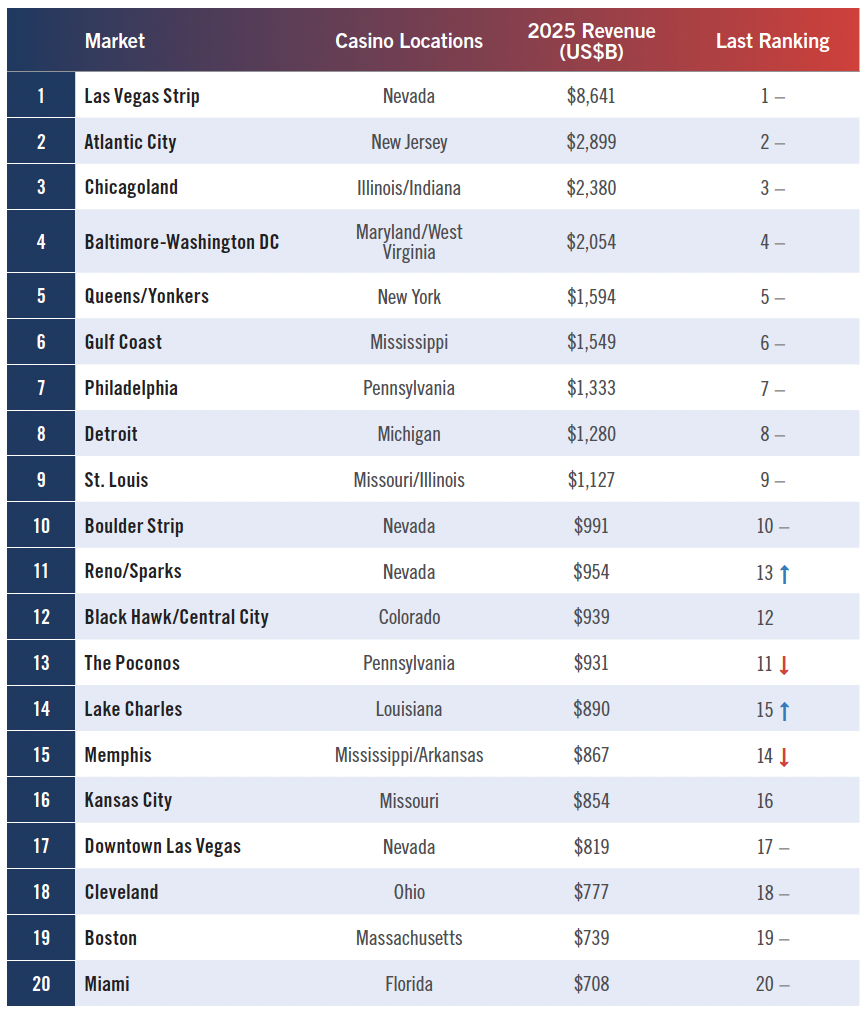
The Las Vegas Strip remained by far the largest commercial casino gaming market in the country in 2025, despite casino-resorts on the Strip reporting near flat gaming revenue growth. The opening of new casinos in Illinois meant the Chicagoland and St. Louis casino markets enjoyed strong growth in 2025 while the Baltimore-Washington D.C., Philadelphia, Detroit and Boston markets were among those that reported declining land-based casino gaming revenue.
Outside of Nevada and Mississippi, which don’t report property level numbers, Resorts World New York City remained the nation’s highest grossing commercial casino facility in 2025. The casino, located in Queens, is currently limited to electronic gaming devices but received a license in December to add table games and a sportsbook as part of a broader redevelopment plan. In terms of 2025 gaming revenue, Resorts World was followed by MGM National Harbor in Maryland, Borgata Hotel Casino & Spa in Atlantic City, Encore Boston Harbor in Massachusetts, and Live! Casino & Hotel Maryland near Baltimore.
Top 20 U.S. Commercial Casino Markets
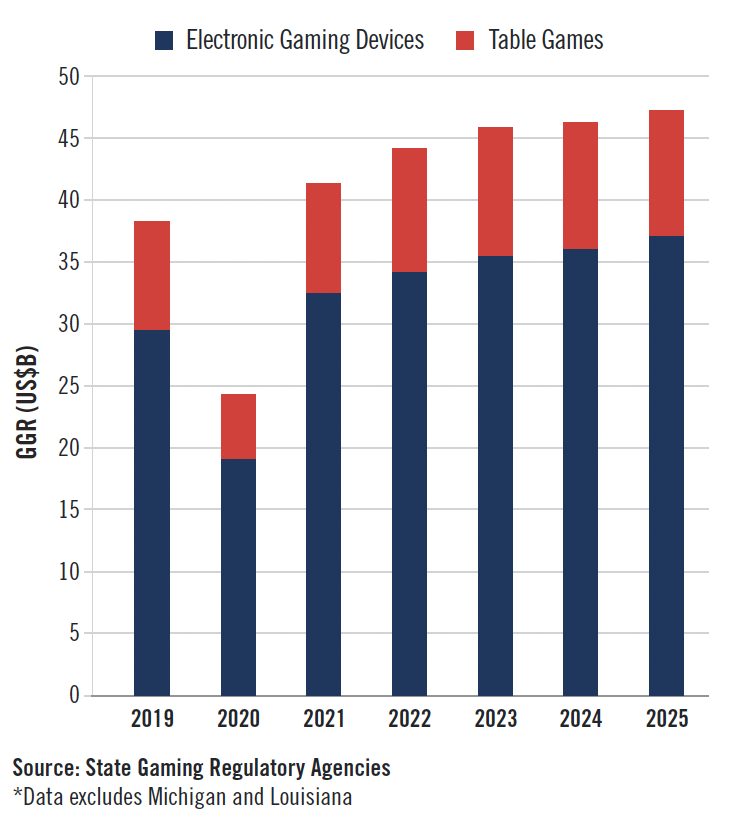
In 2025, America’s 493 commercial casino locations across 27 states reported record annual revenue of $51.06 billion from their traditional casino games. The total revenue from electronic gaming devices and table games was up 2.3 percent compared to the previous year.
Land Based Casino GGR By Category
2019 to 2025
Sports Betting
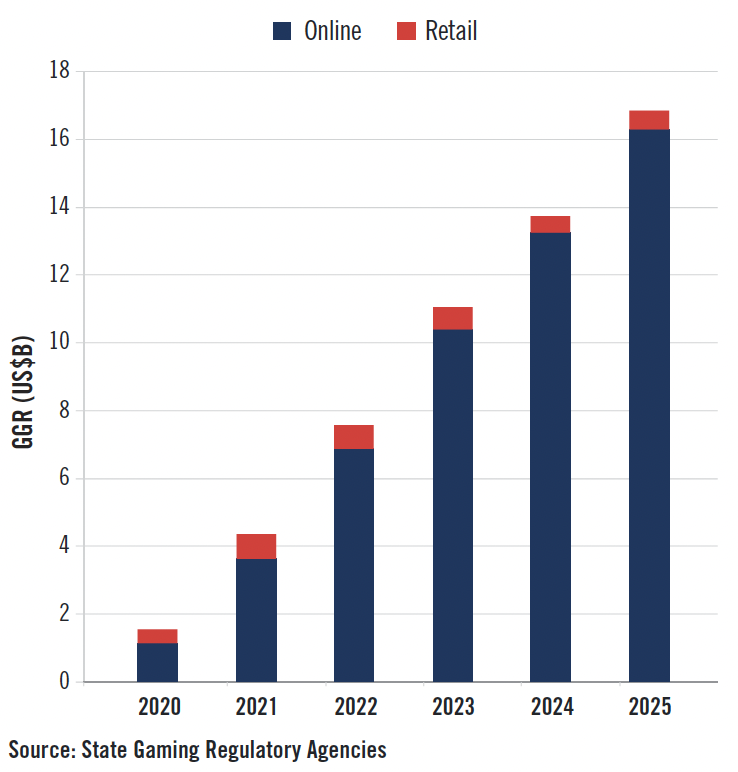
In 2025, total revenue from commercial sports betting operations across the United States was $16.89 billion, an increase of 22.6 percent compared to the previous year. Notably, the sports betting total does not include revenue earned by sportsbooks in tribal casinos or from mobile sports betting in Florida, which is also conducted as a form of tribal gaming.
Commercial Sports Betting GGR
2020 to 2025
iGaming
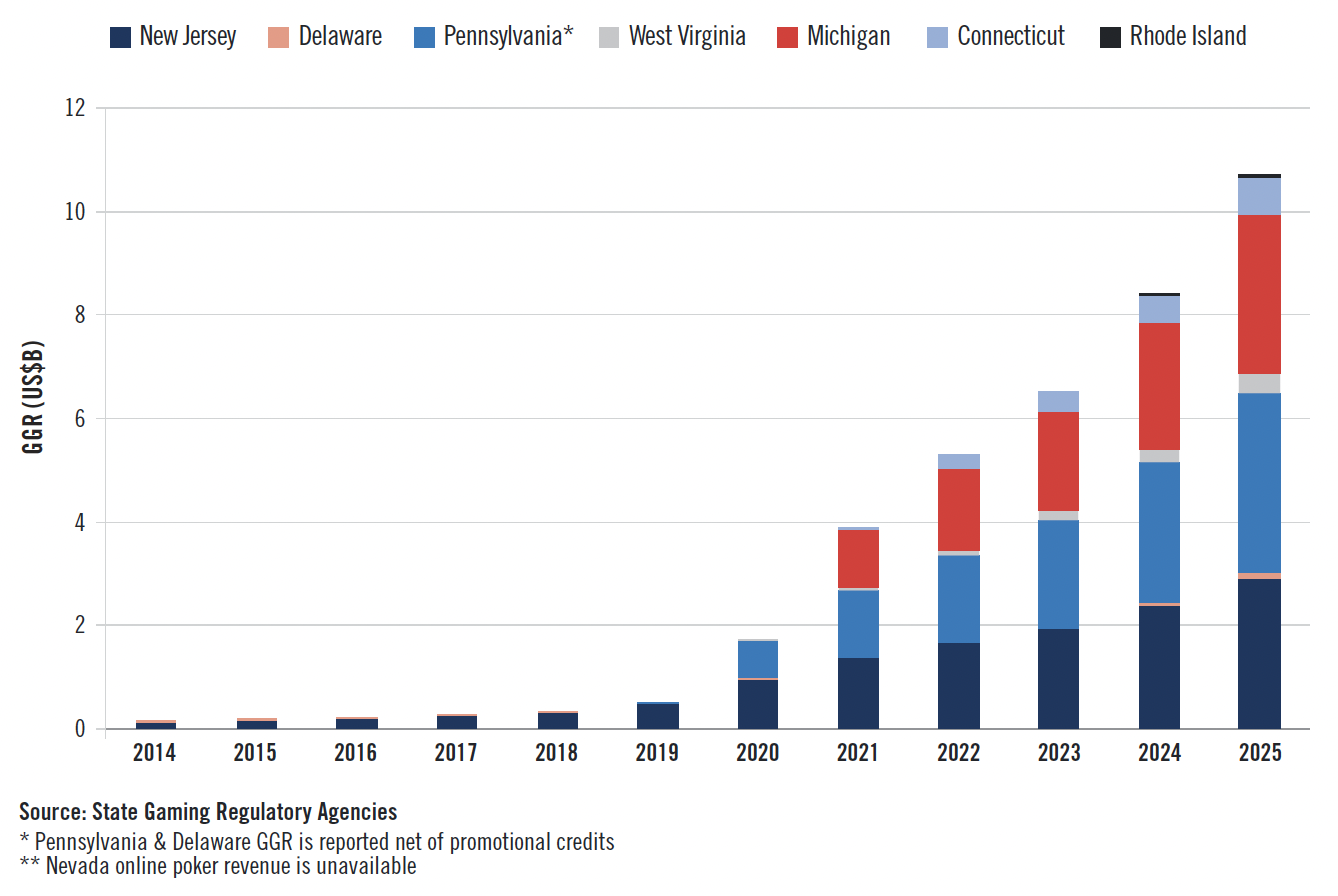
Internet gaming revenue across the seven states with lawful online casinos exceeded $10 billion in 2025, as overall iGaming revenue grew by 27.6 percent to a record total of $10.73 billion. Although the iGaming markets of Delaware, Rhode Island and West Virginia reported the strongest growth, Michigan, New Jersey and Pennsylvania continued to account for nearly 90 percent of the nationwide total.
Pennsylvania remained the largest market, with statewide revenue increasing by nearly 28 percent to $3.46 billion. Annual iGaming revenue surpassed that of commercial land-based casinos in both Pennsylvania and New Jersey for the first time in 2025. Maine was the only state to pass legislation legalizing iGaming in 2025, though the legislation did not become law until early in 2026.
Illegal Gaming
Perhaps the most pressing gaming policy concern of state regulators and law enforcement officials in 2025 was the growing prominence of unregulated and illegal gaming operations.
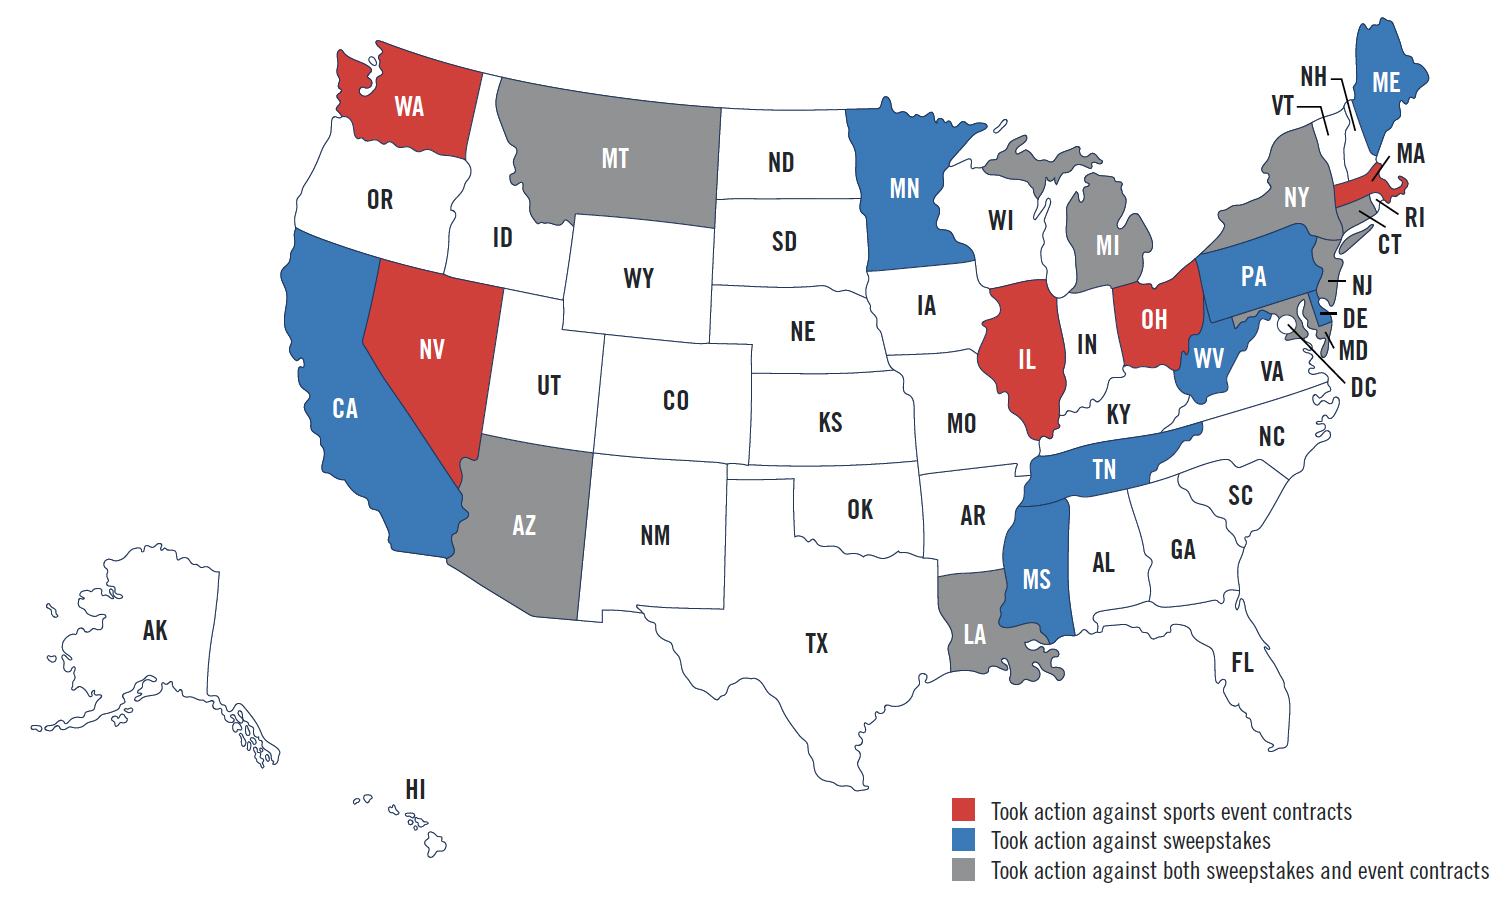
During the course of the year, state and tribal governments in 16 states took action against prediction market platforms offering contracts based on the outcome of sporting events. Those actions included cease and desist orders, directly suing prediction market operators in court, and publishing guidance or formal opinions declaring sports event contracts to be a form of unauthorized sports wagering subject to state licensure and oversight.
Five states—California, Connecticut, Montana, New Jersey and New York—passed new legislation in 2025 to explicitly prohibit sweepstakes gaming platforms that mimic online casinos or sportsbooks. Arizona and Louisiana were among a number of other states that took enforcement measures against sweepstakes based on pre-existing laws.
Meanwhile, gaming regulators in states such as Florida, Michigan, Mississippi and Tennessee continued to take action against illegal offshore sportsbooks and casinos, as policymakers and courts in Missouri, Pennsylvania and Virginia also addressed the issue of unregulated devices offering unlicensed gaming under the guise of “skill games.”
In August, the AGA released new analysis showing that unregulated gaming devices, offshore sportsbooks and illegal online casinos generate an estimated $53.9 billion in revenue annually, depriving states of more than $15 billion in lost tax revenue. That total does not include the many hundreds of millions in sports wagering tax revenue being lost due to sports event contracts offered through prediction markets.
2025 Enforcement Activity
About State of the States
AGA’s annual State of the States report details the commercial gaming industry’s financial performance, including analyses of each of the 38 jurisdictions with commercial gaming operations in 2024. The report, developed with VIXIO Regulatory Intelligence, also provides a breakdown of the legality of types of gaming and number of casinos by state, summarizes major gaming policy discussions, and previews opportunities and challenges for the industry. The companion State of Play map provides the report findings, as well as key regulatory and statutory requirements for each state, in an easy-to-use, interactive tool.